Market
Learn more about the current state of Tysons' real estate market across the office, residential, retail, and hospitality sectors.
Office
Office
Office Inventory
29M
Square Feet
2023 Market Study
Office
Approved Office SF
18.4M
2023 Fairfax County
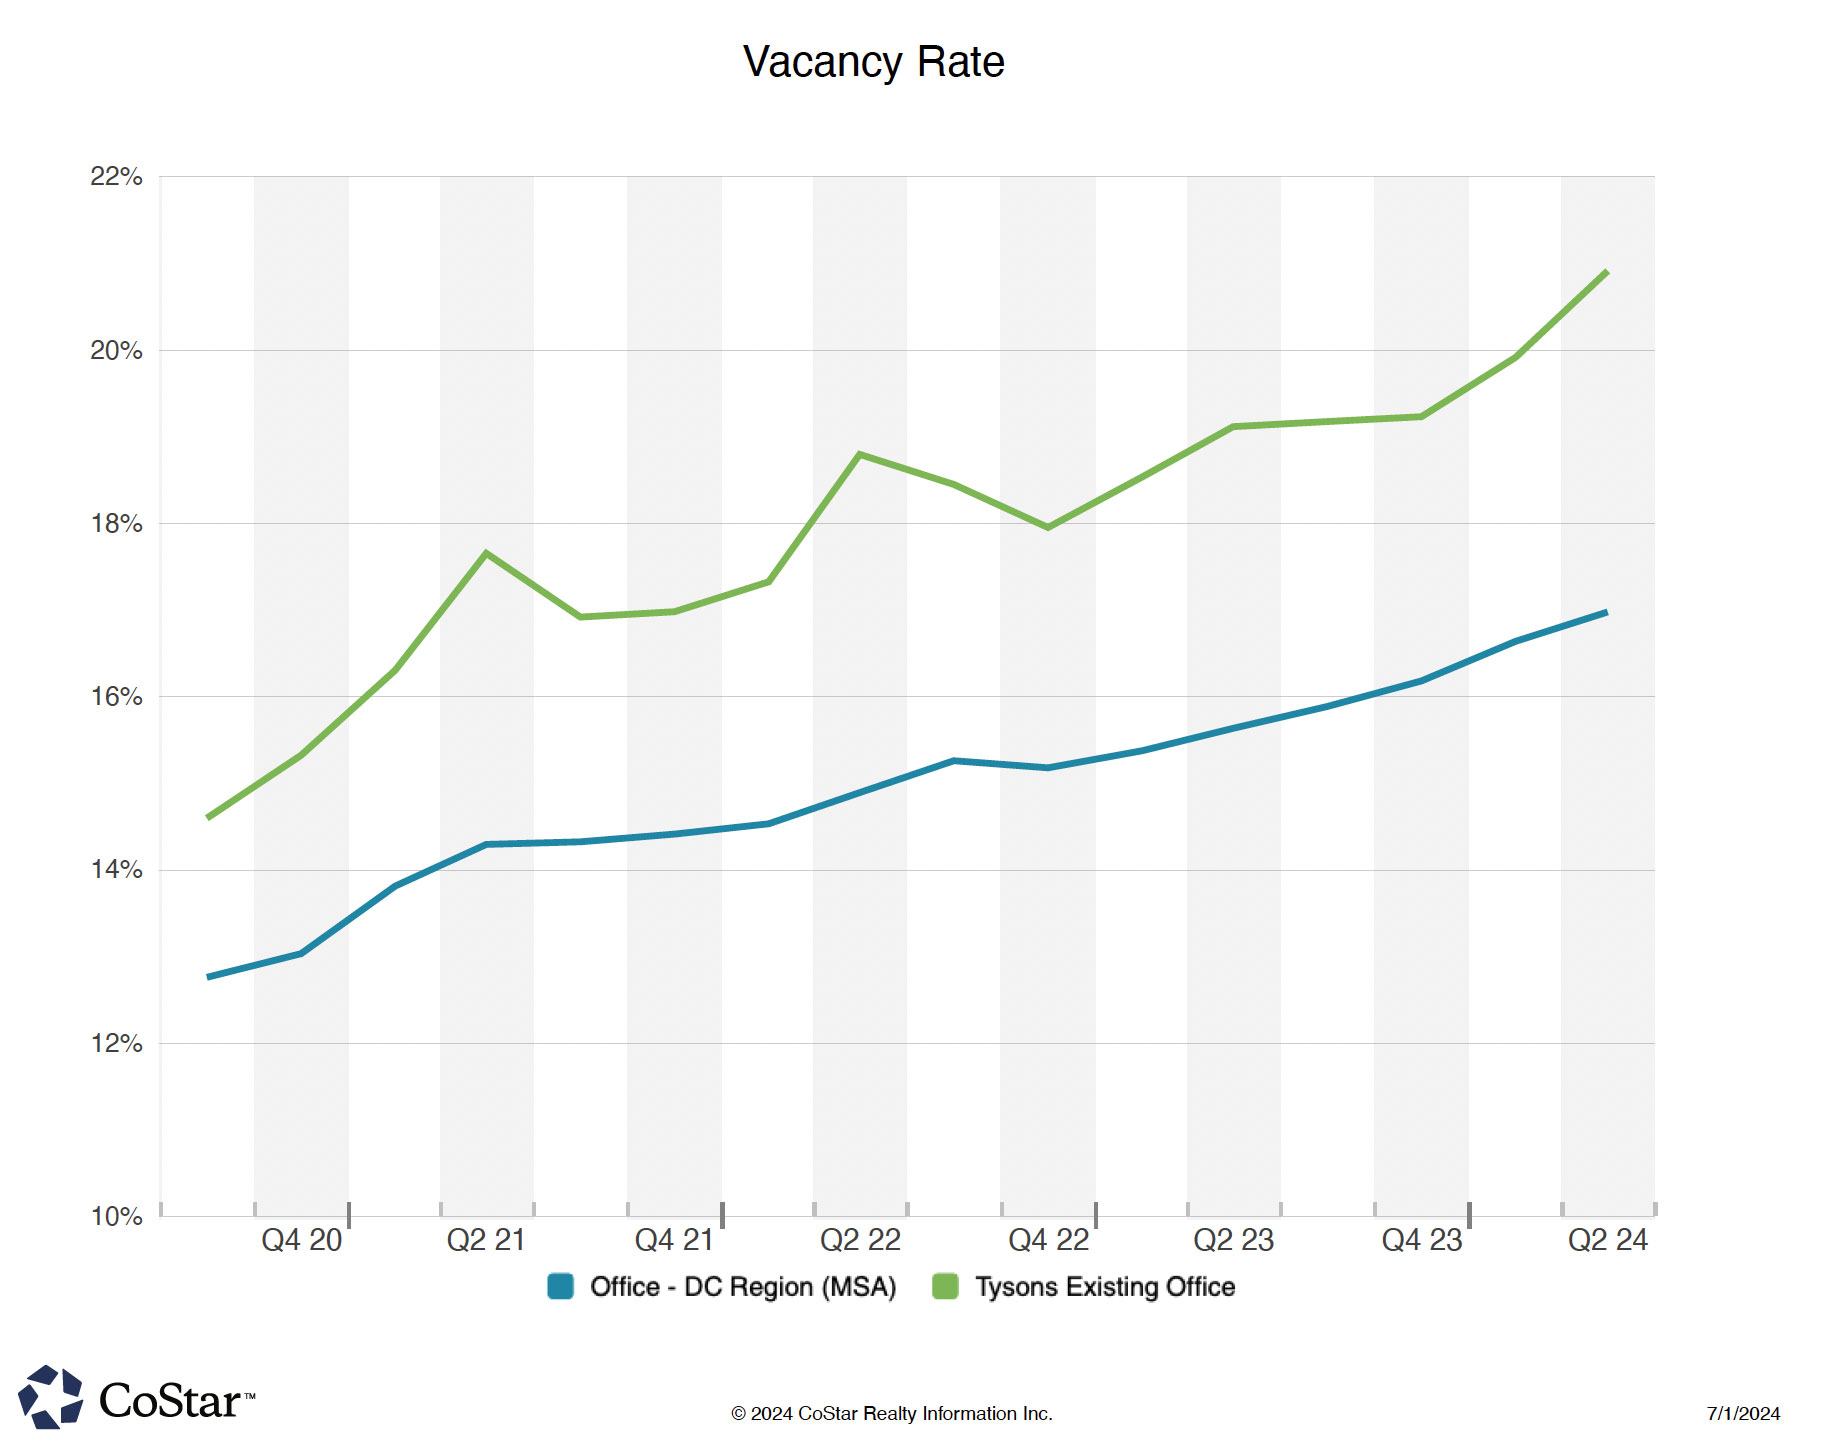
Office
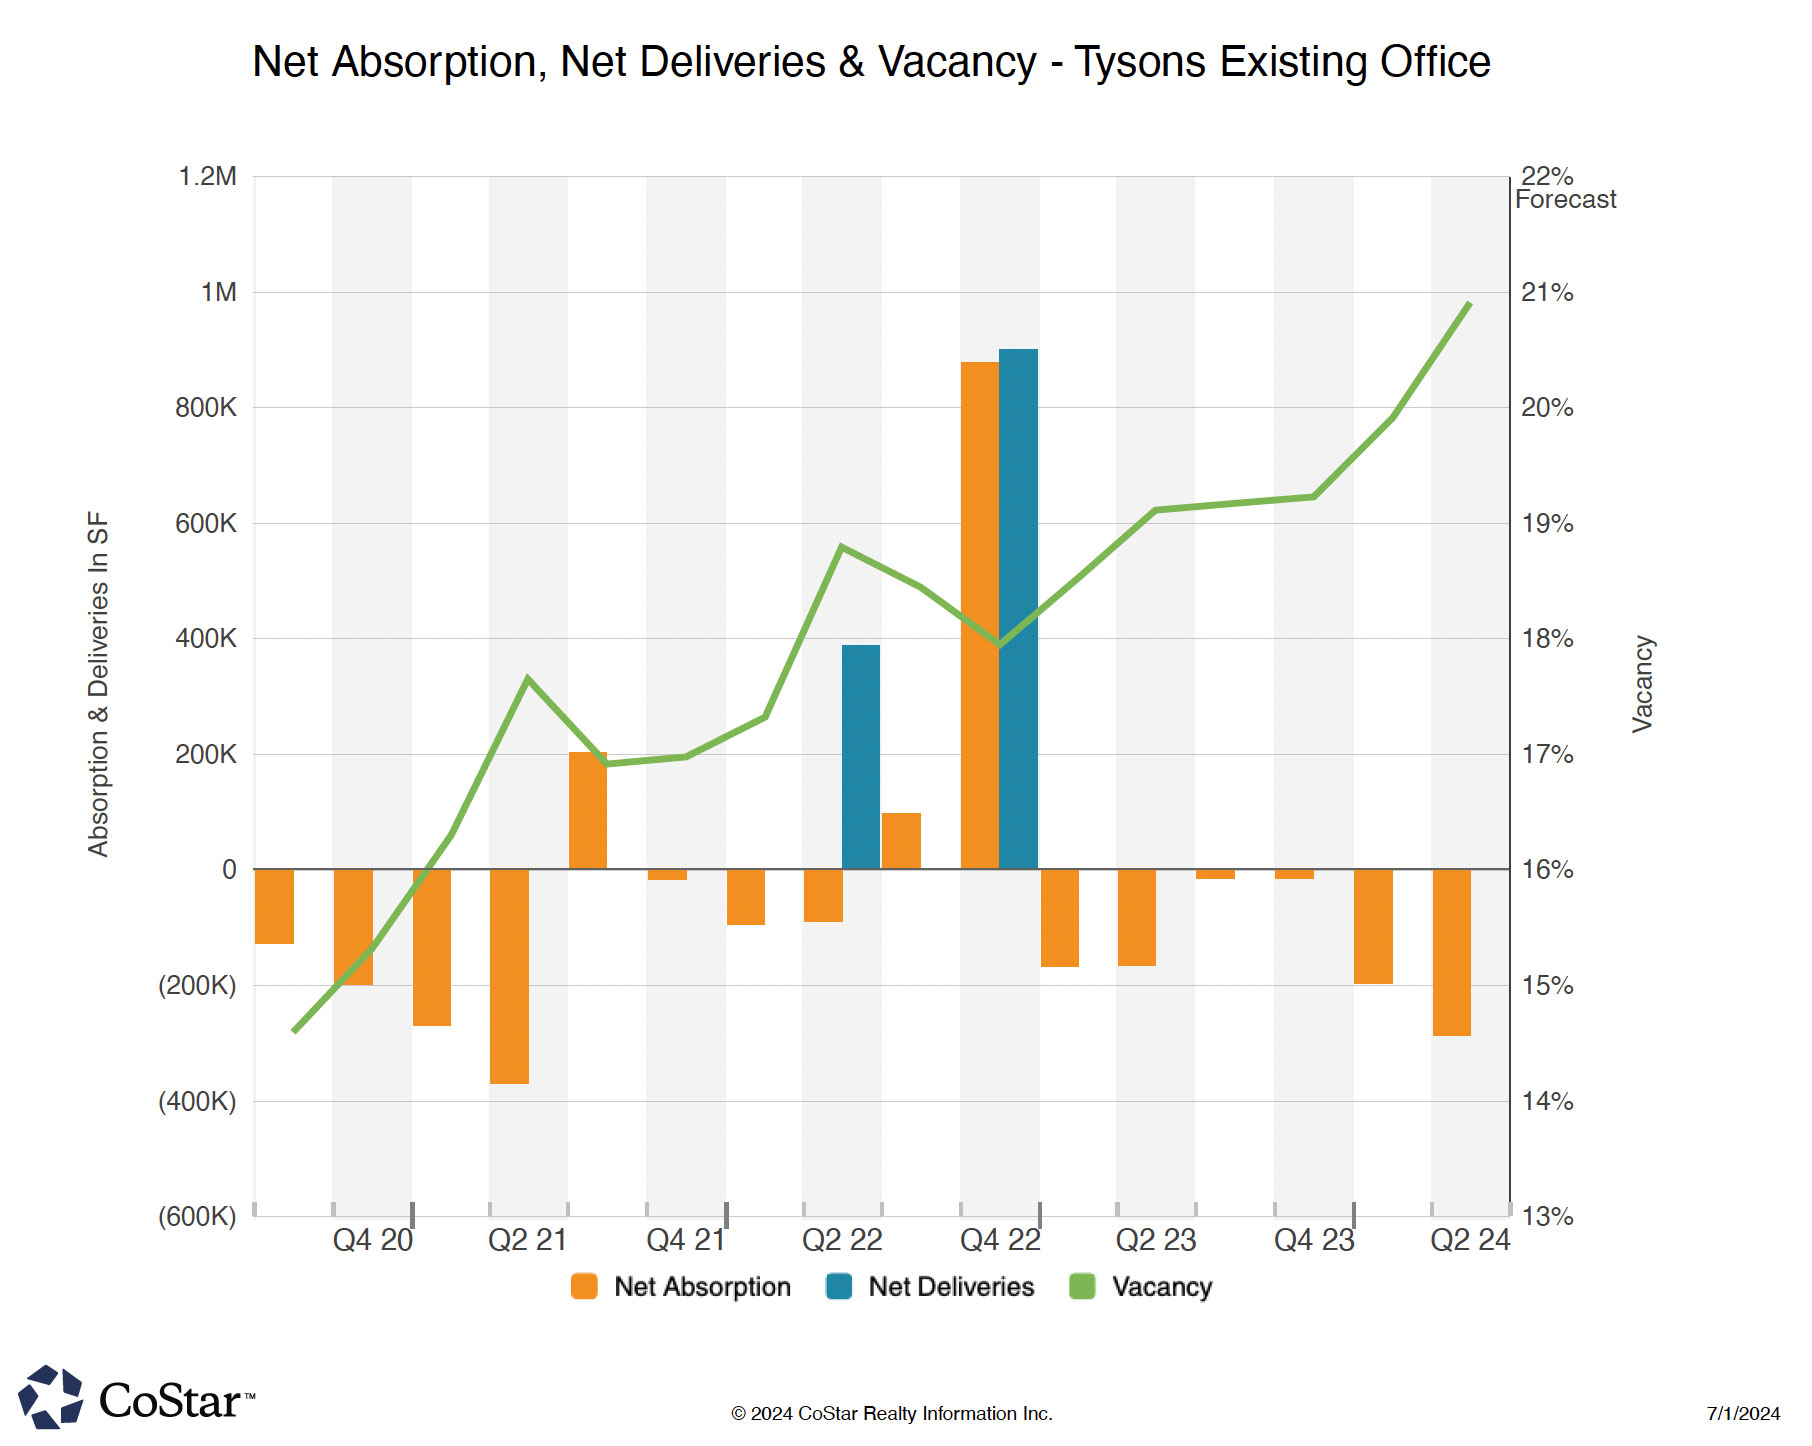
Office Vacancy
21%
Q2 2024 CoStar
Office
Total Office SF delivered since 2010
4.3M
2024 Development Pipeline
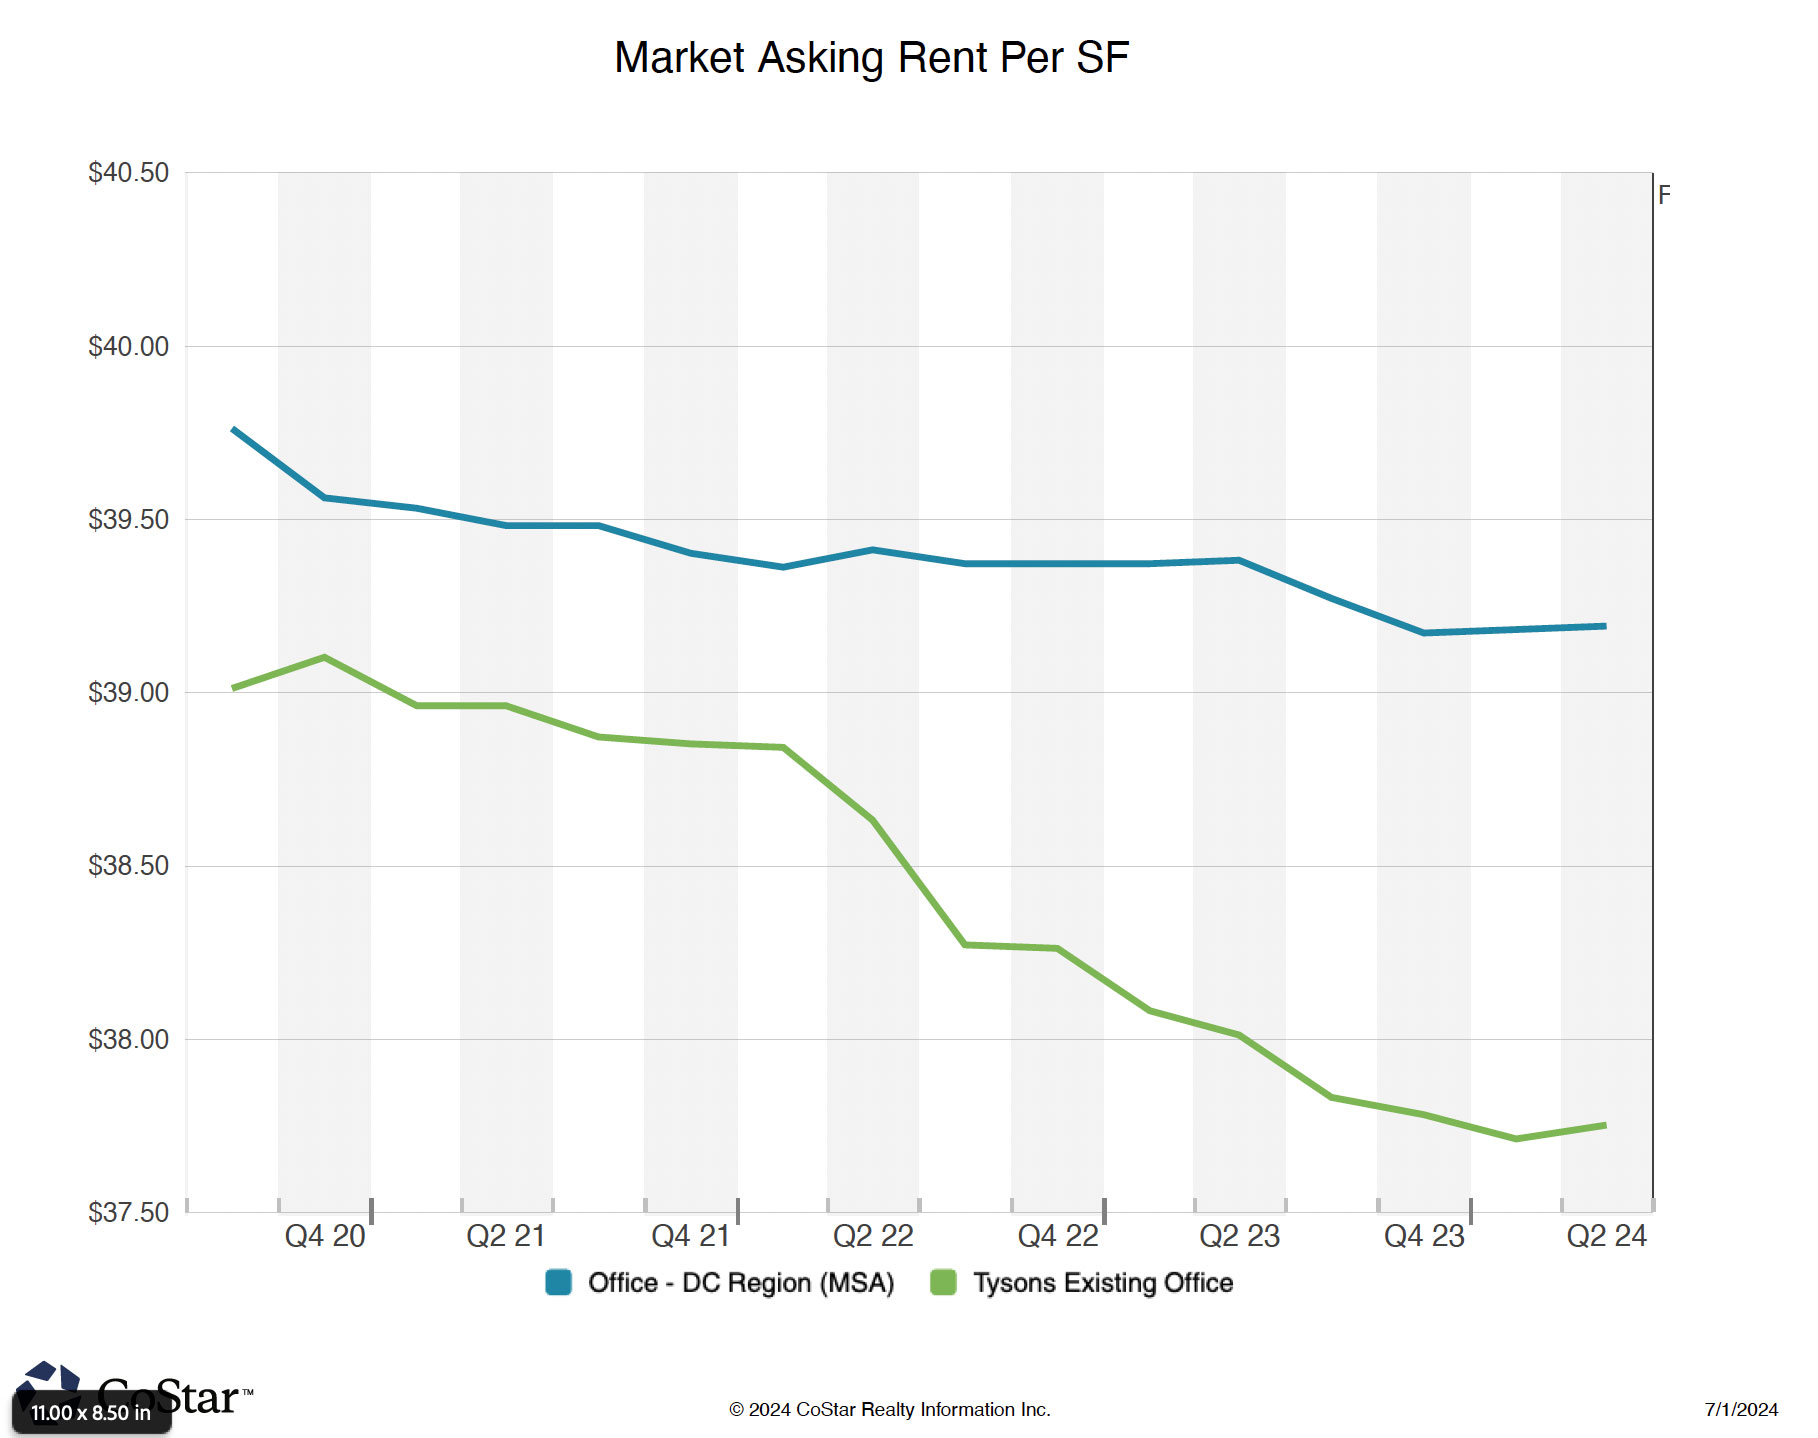
Office
Market Asking Rent/SF
$37.75
Q2 2024 CoStar
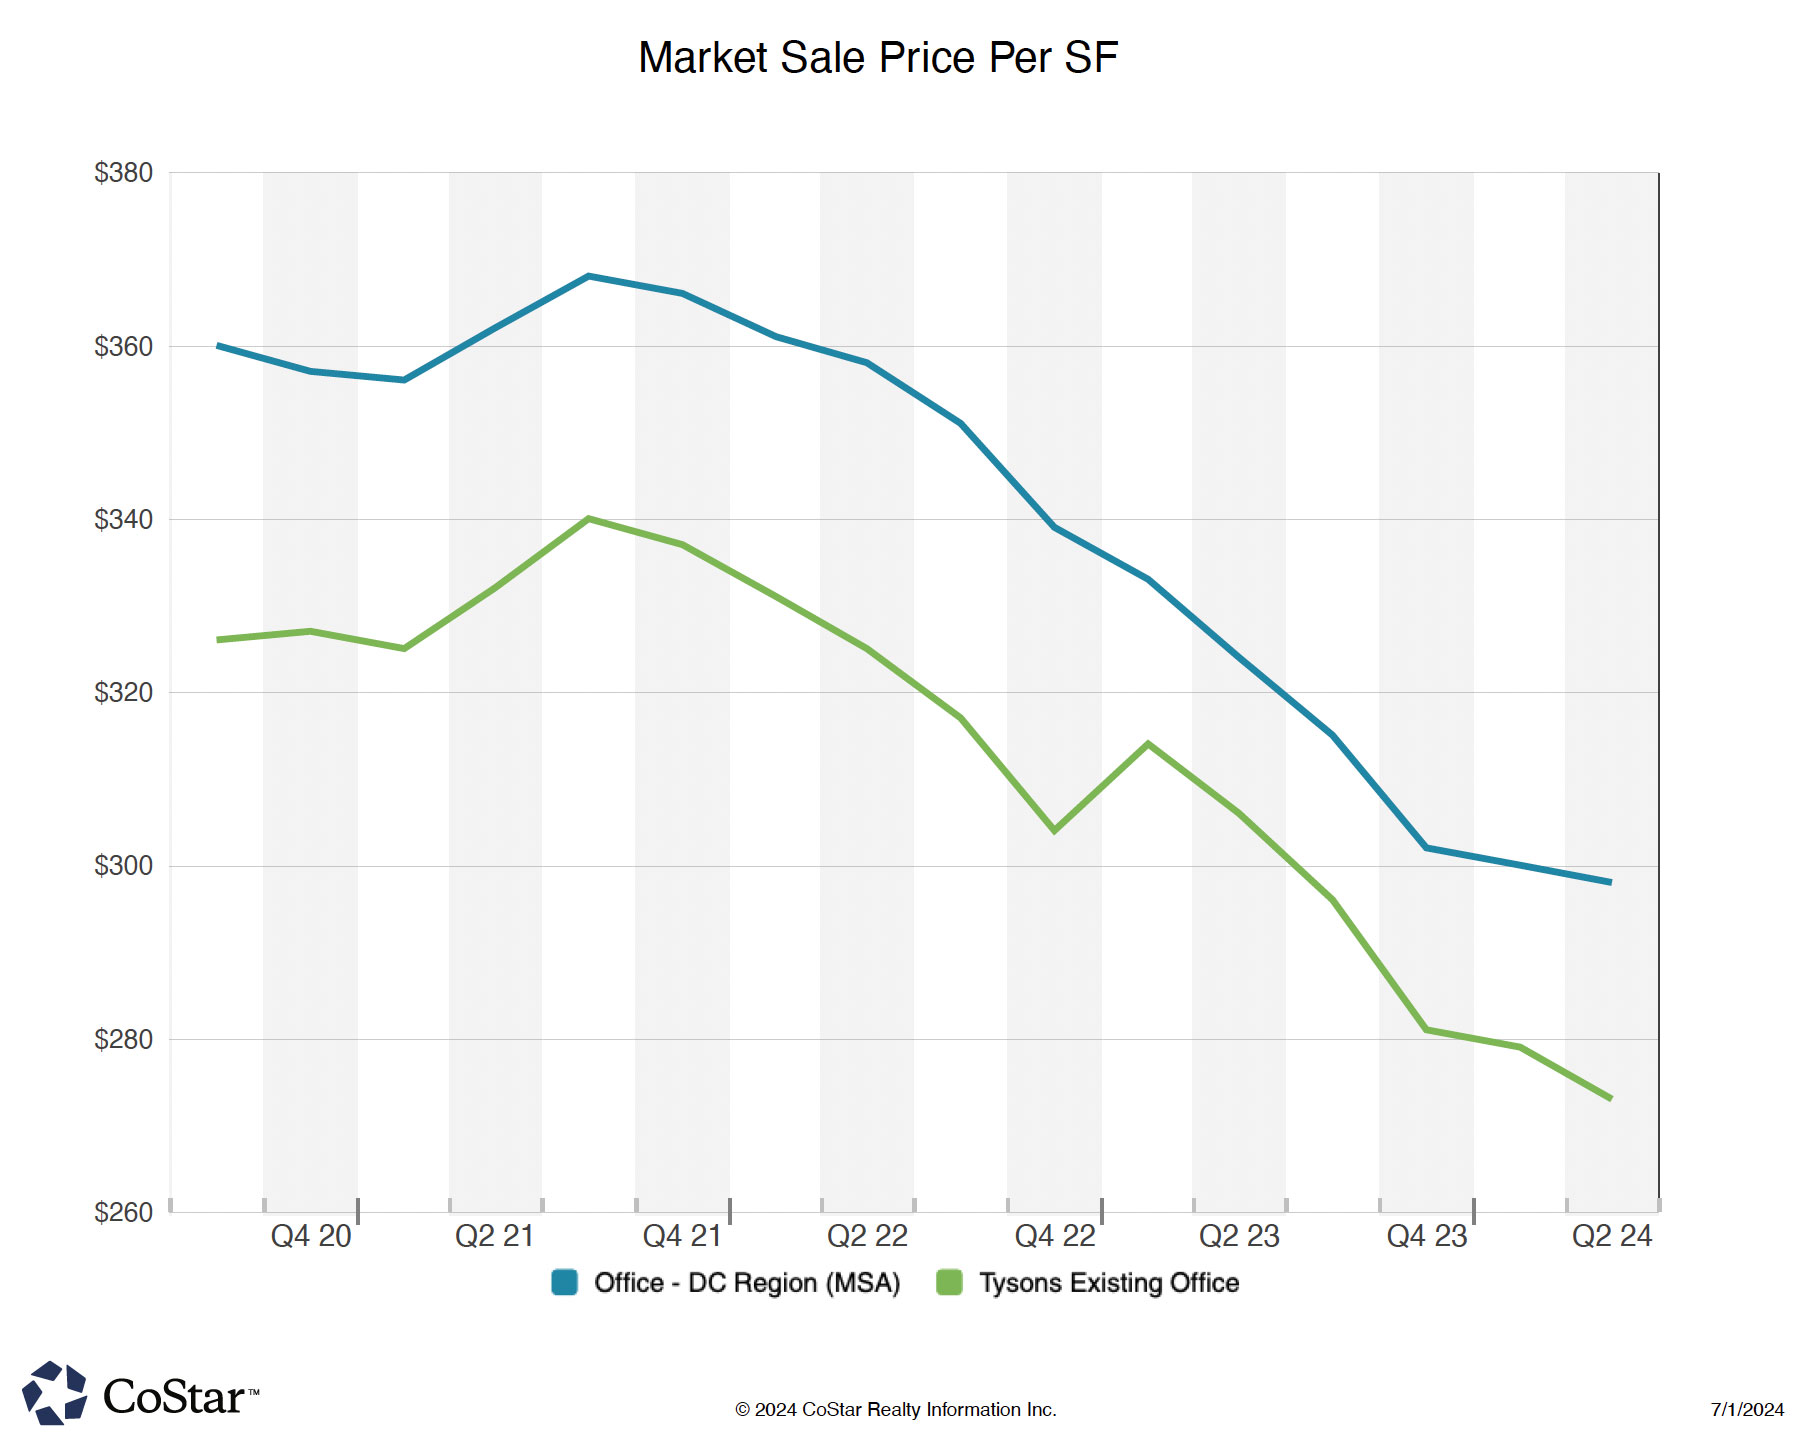
Office
Market Sales Price/SF
$273
Q2 2024 CoStar
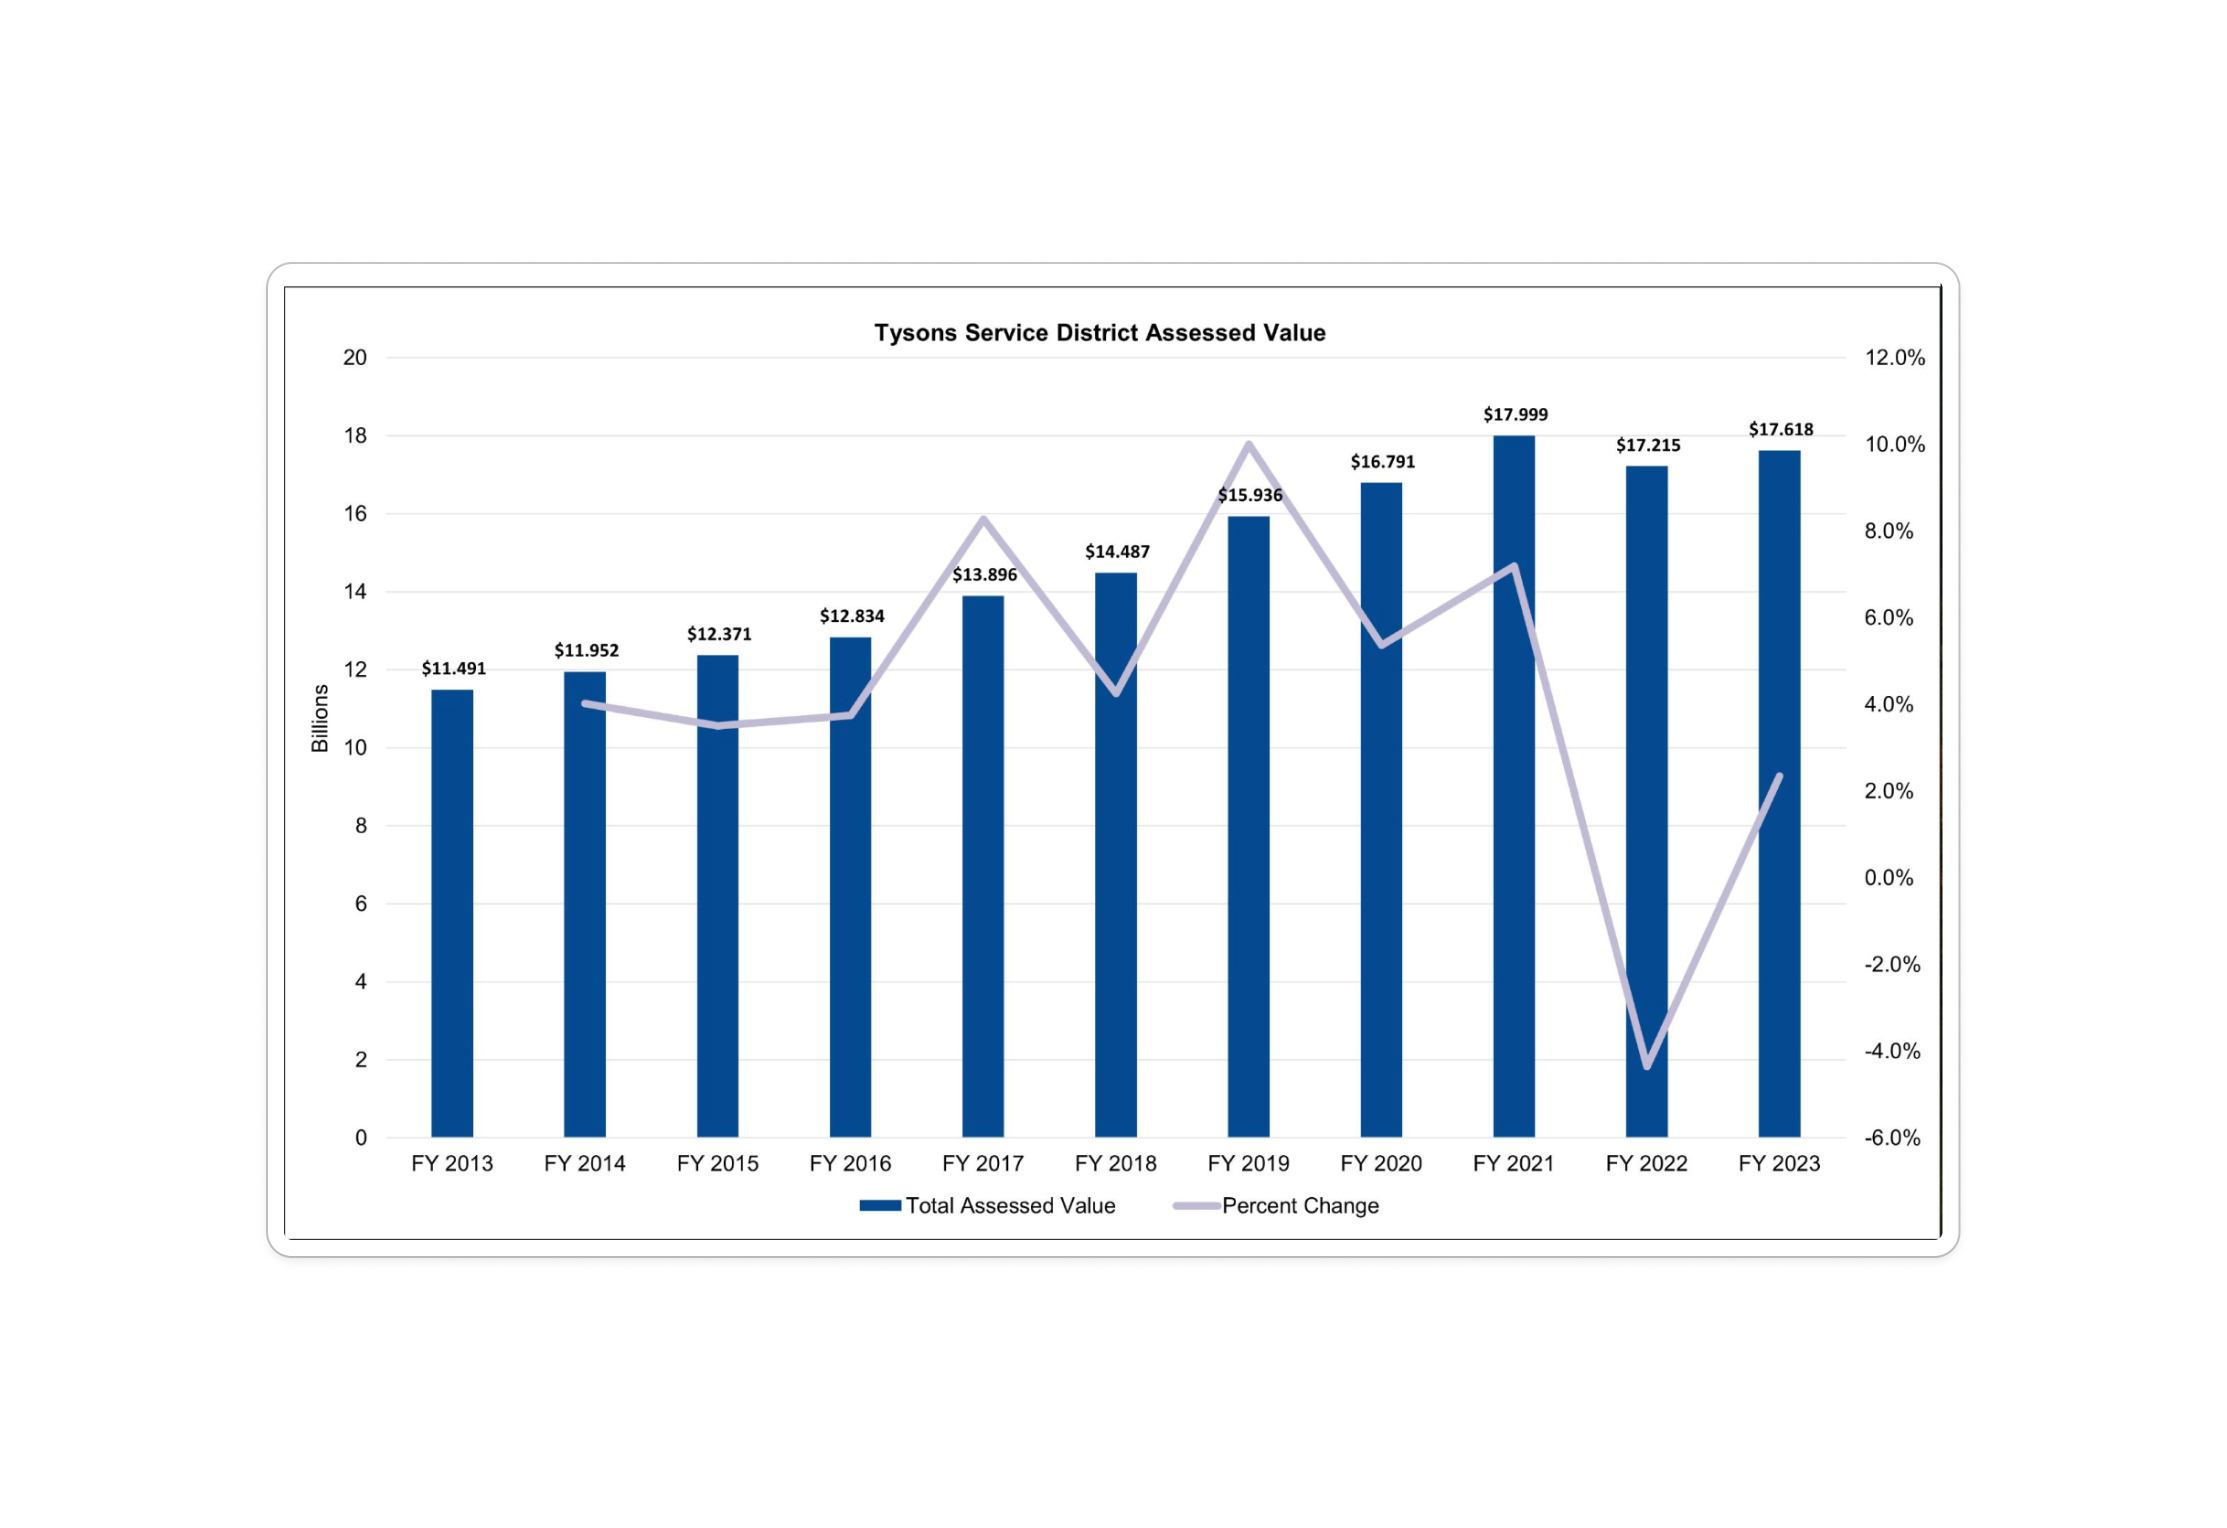
Office
Growth in Office Rents 2020-2023
7%
2023 Market Study
Office
% of Office that is Class A
76%
2023 Market Study
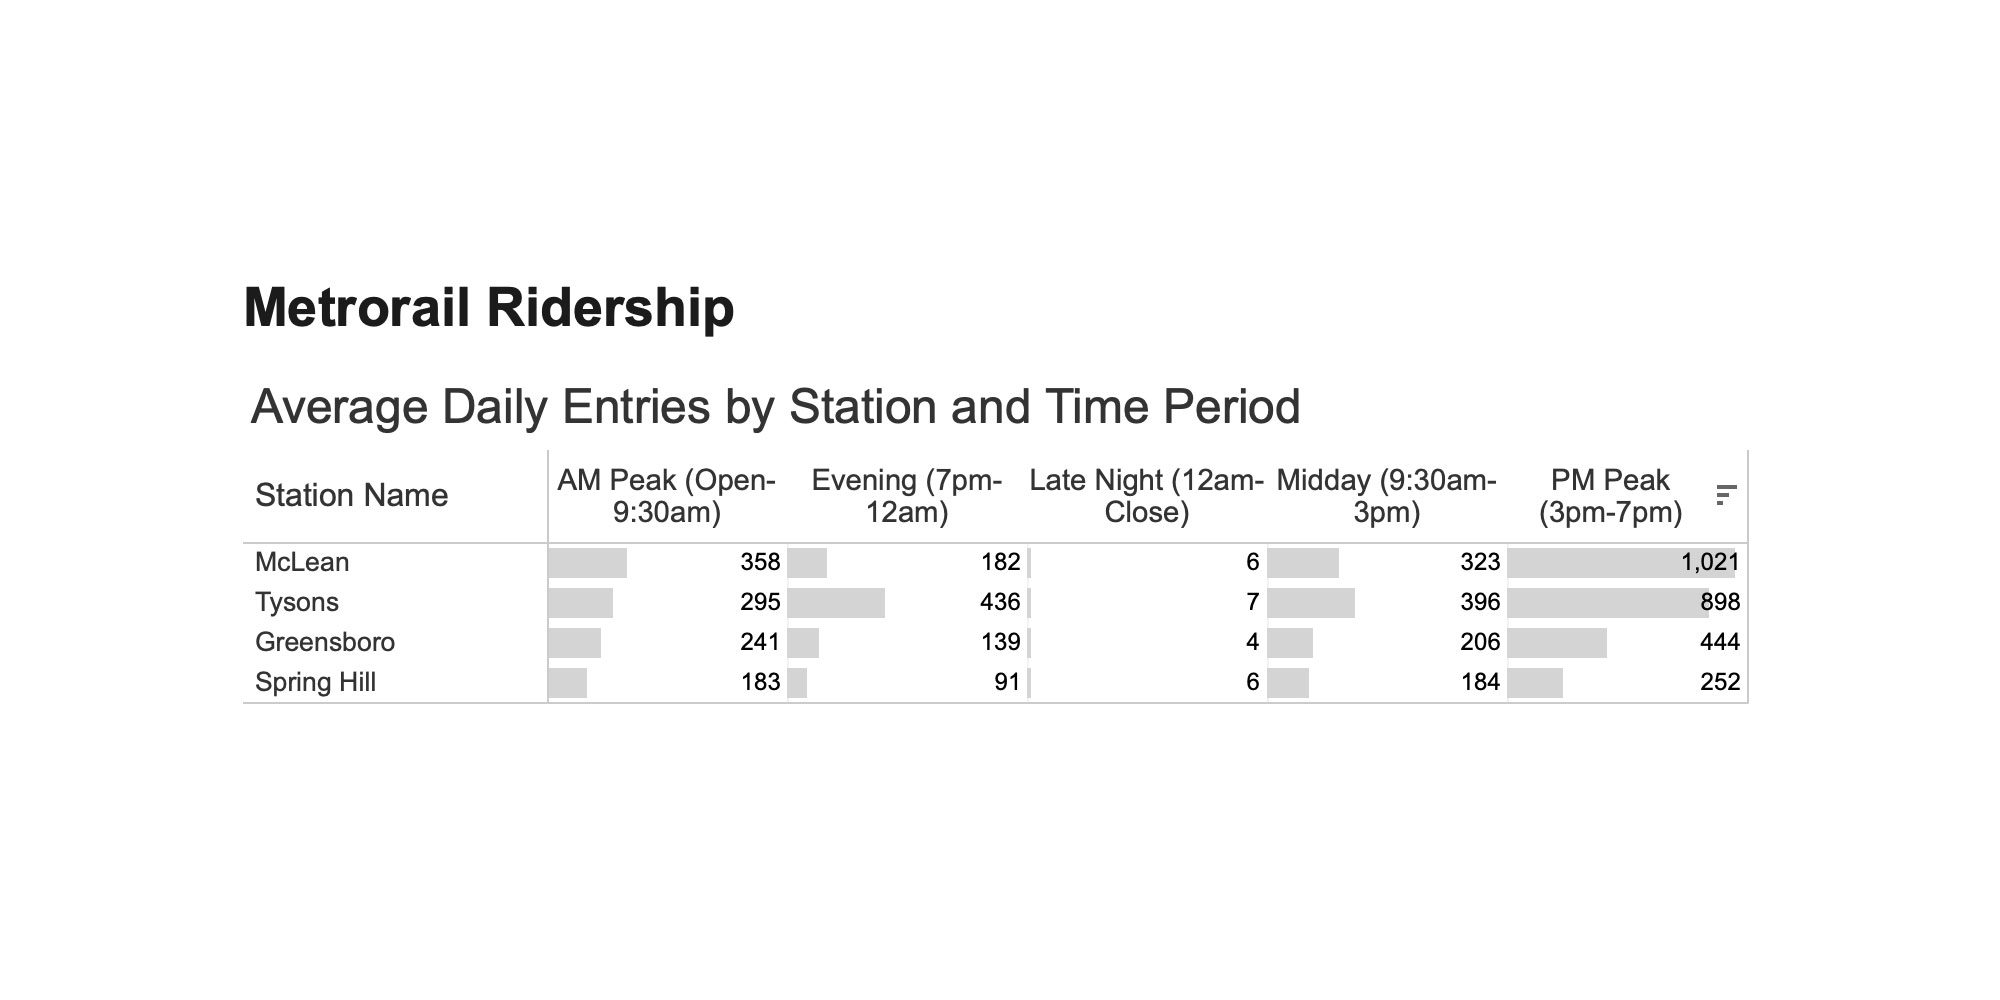
Employment
Annual Employee Visits
Q2 2024 Placer.ai
Employment
Monthly Employee Visits (Previous 12 Months)
Q2 2024 Placer.ai
Economy
Office-Using Workers
96K
of the total 116K workers are office using
of the total 116K workers are office using
Office
Net Absorption
-287.5K
Square Feet
Q2 2024 CoStar

Residential
Residential
Residential Inventory SF
17.7M
2023 Market Study
Residential
Residential Inventory Units
15k
2023 Market Study
Residential
Residential SF Under Construction
1.3M
Q2 2024 Development Pipeline
Residential
Units Under Construction
1.2K
Q2 2024 Development Pipeline
Demographic
Total Population
29K
2023 Market Study
Demographic
Projected Population Growth 2023-2030
4.6%
2023 Market Study
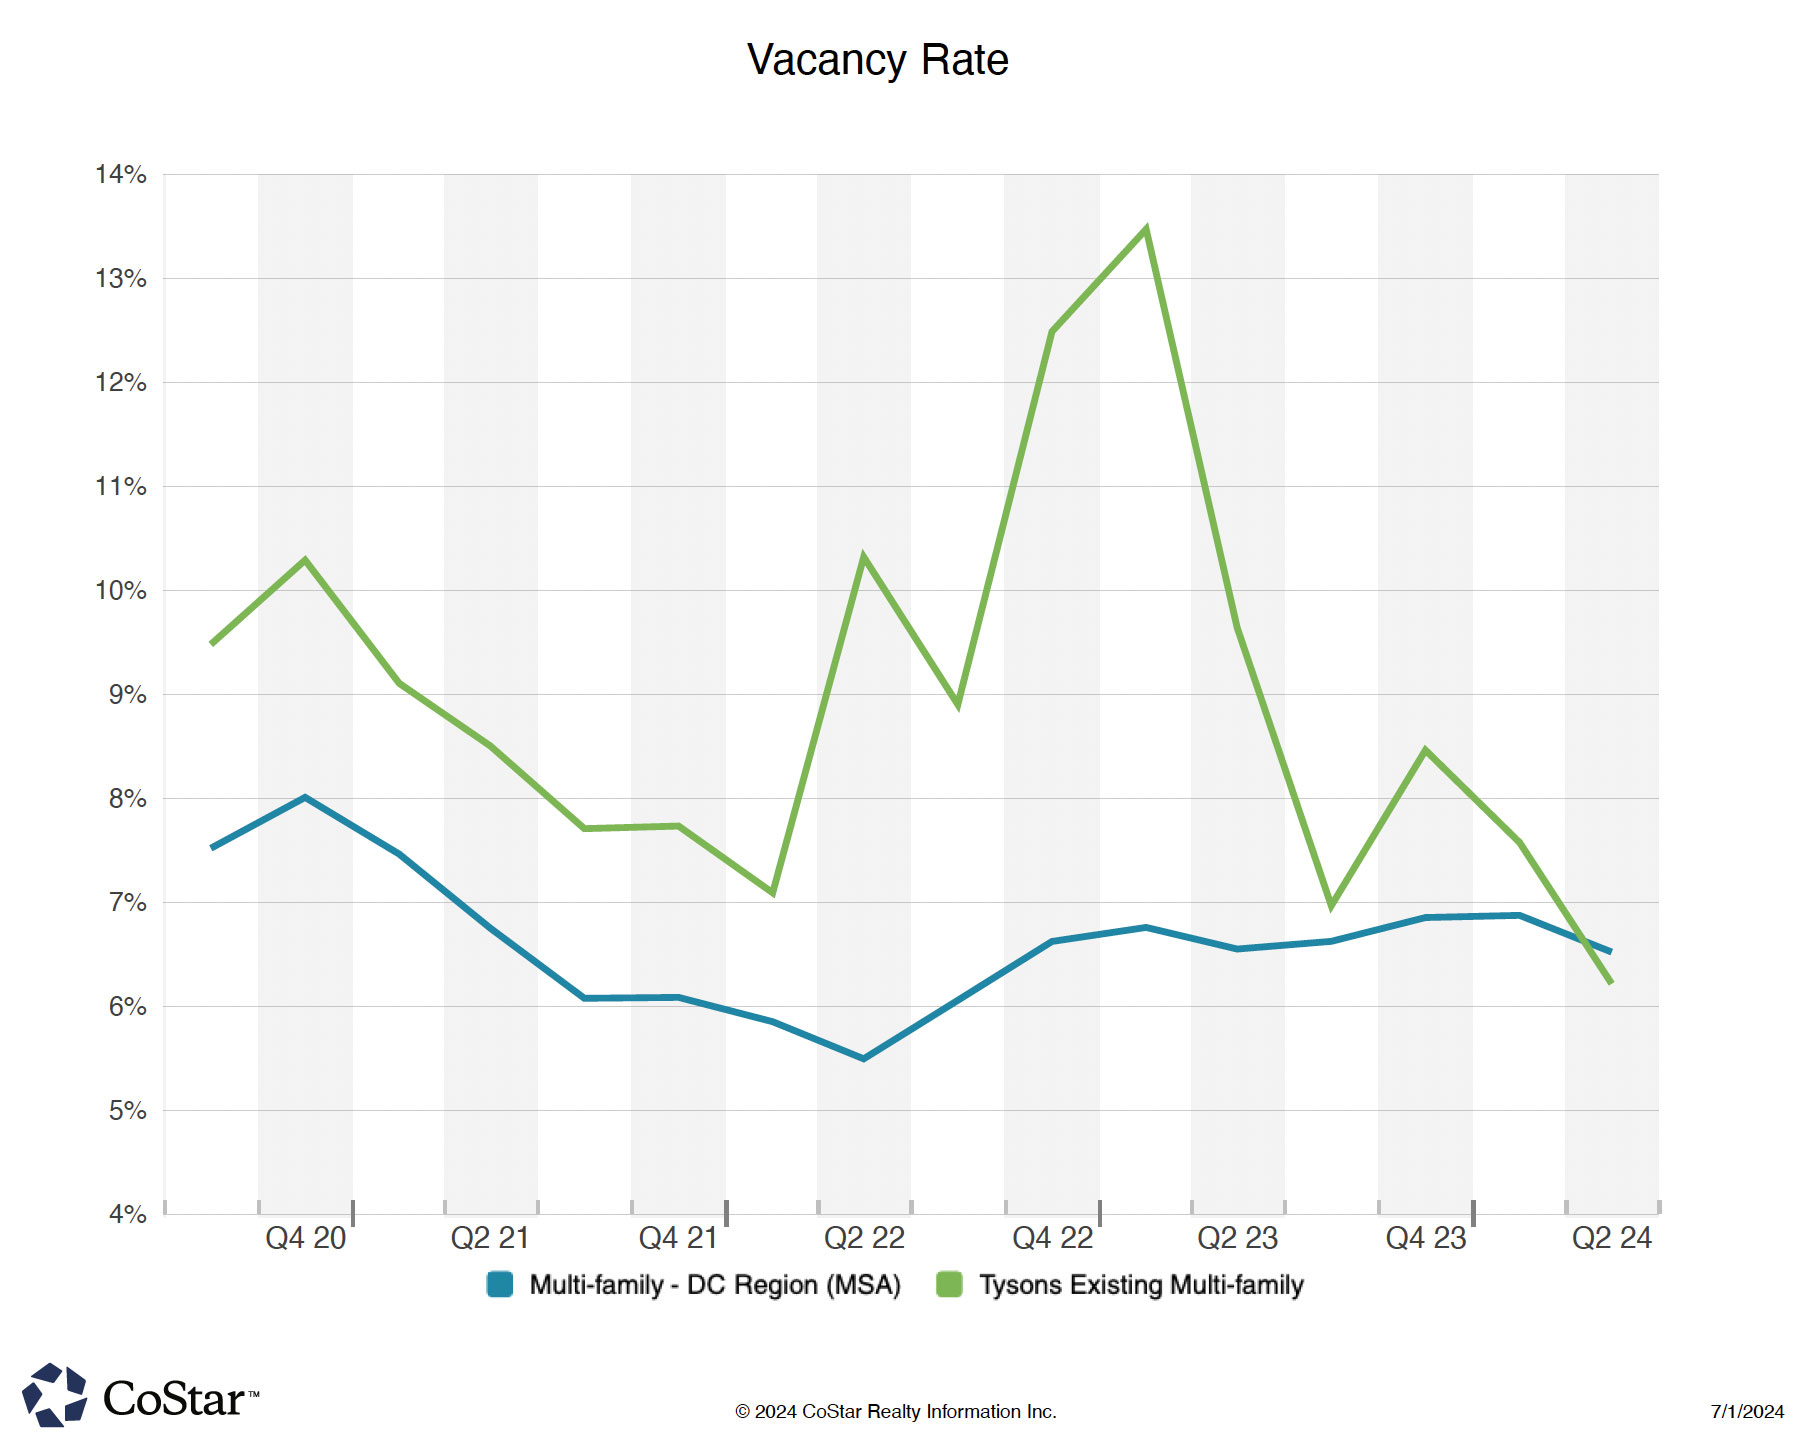
Residential
Residential Vacancy
6%
Q2 2024 CoStar

Residential
Affordable Units Under Construction
976
Q2 2024 Development Pipeline
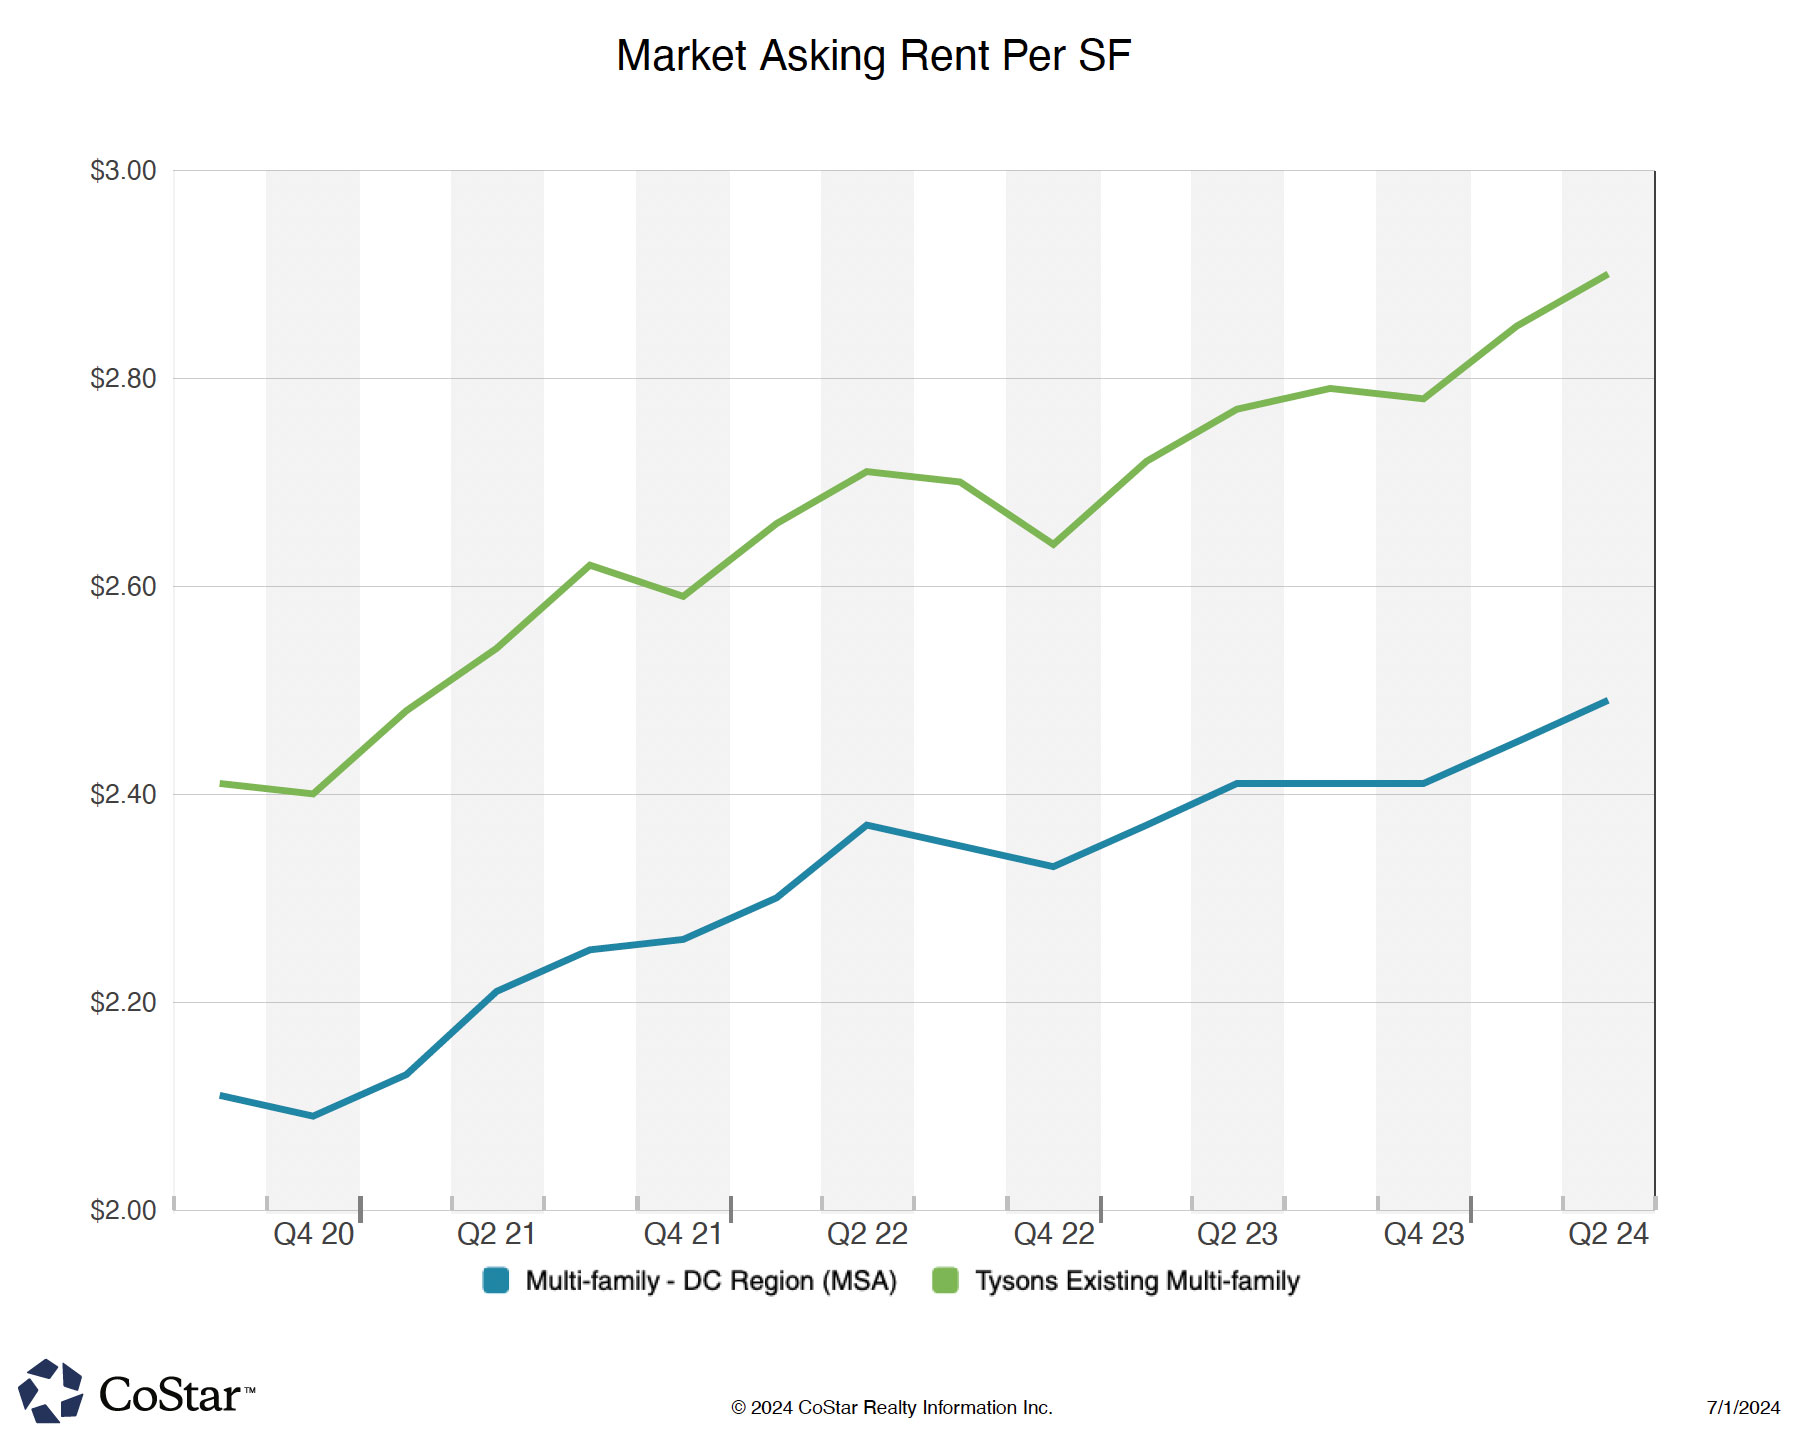
Residential
Average Rent per SF
$2.9
Q2 2024 CoStar
Residential
Projected Multi-Family Unit growth by 2033
82%
2023 Market Study
Residential
Total SF Residential delivered since 2010
7.8M
Q2 2024 Development Pipeline
Residential
Distribution of Affordable and Market Rate Units Under Construction
57%
Affordable Units
Residential
Percent Owned and Rented Units
Owned
vs
Rented
2023 Market Study
Residential
Distribution of Existing Units
2023 Market Study
Retail
Retail
Retail Inventory SF
5.5M
Square Feet
2023 Market Study
Retail
Retail SF Under Construction
14.8K
Square Feet
Q2 2024 Development Pipeline
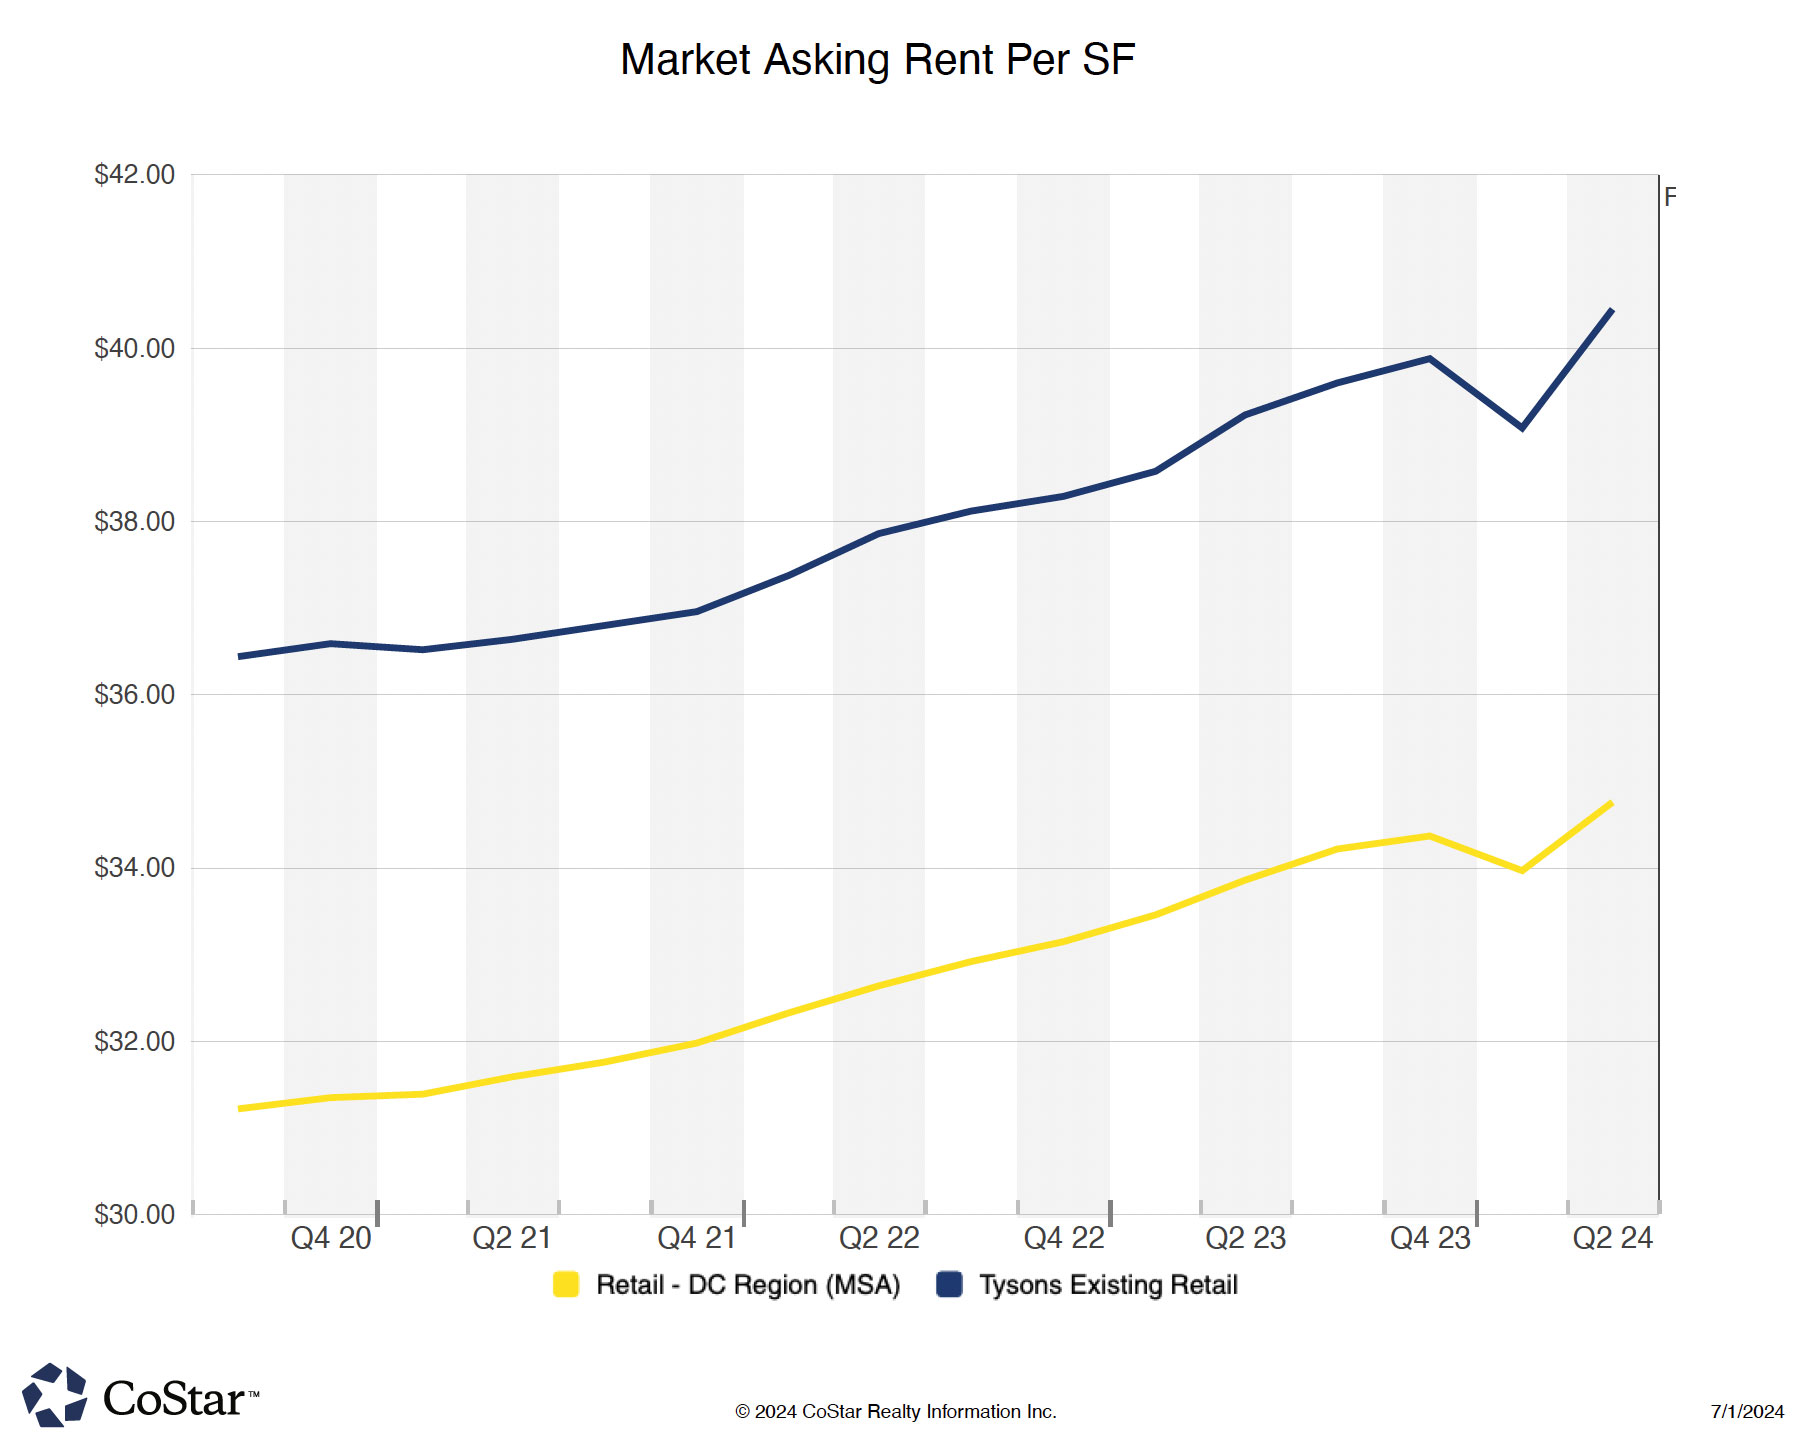
Retail
Average Retail Rent per SF
$40.44
Q2 2024 CoStar
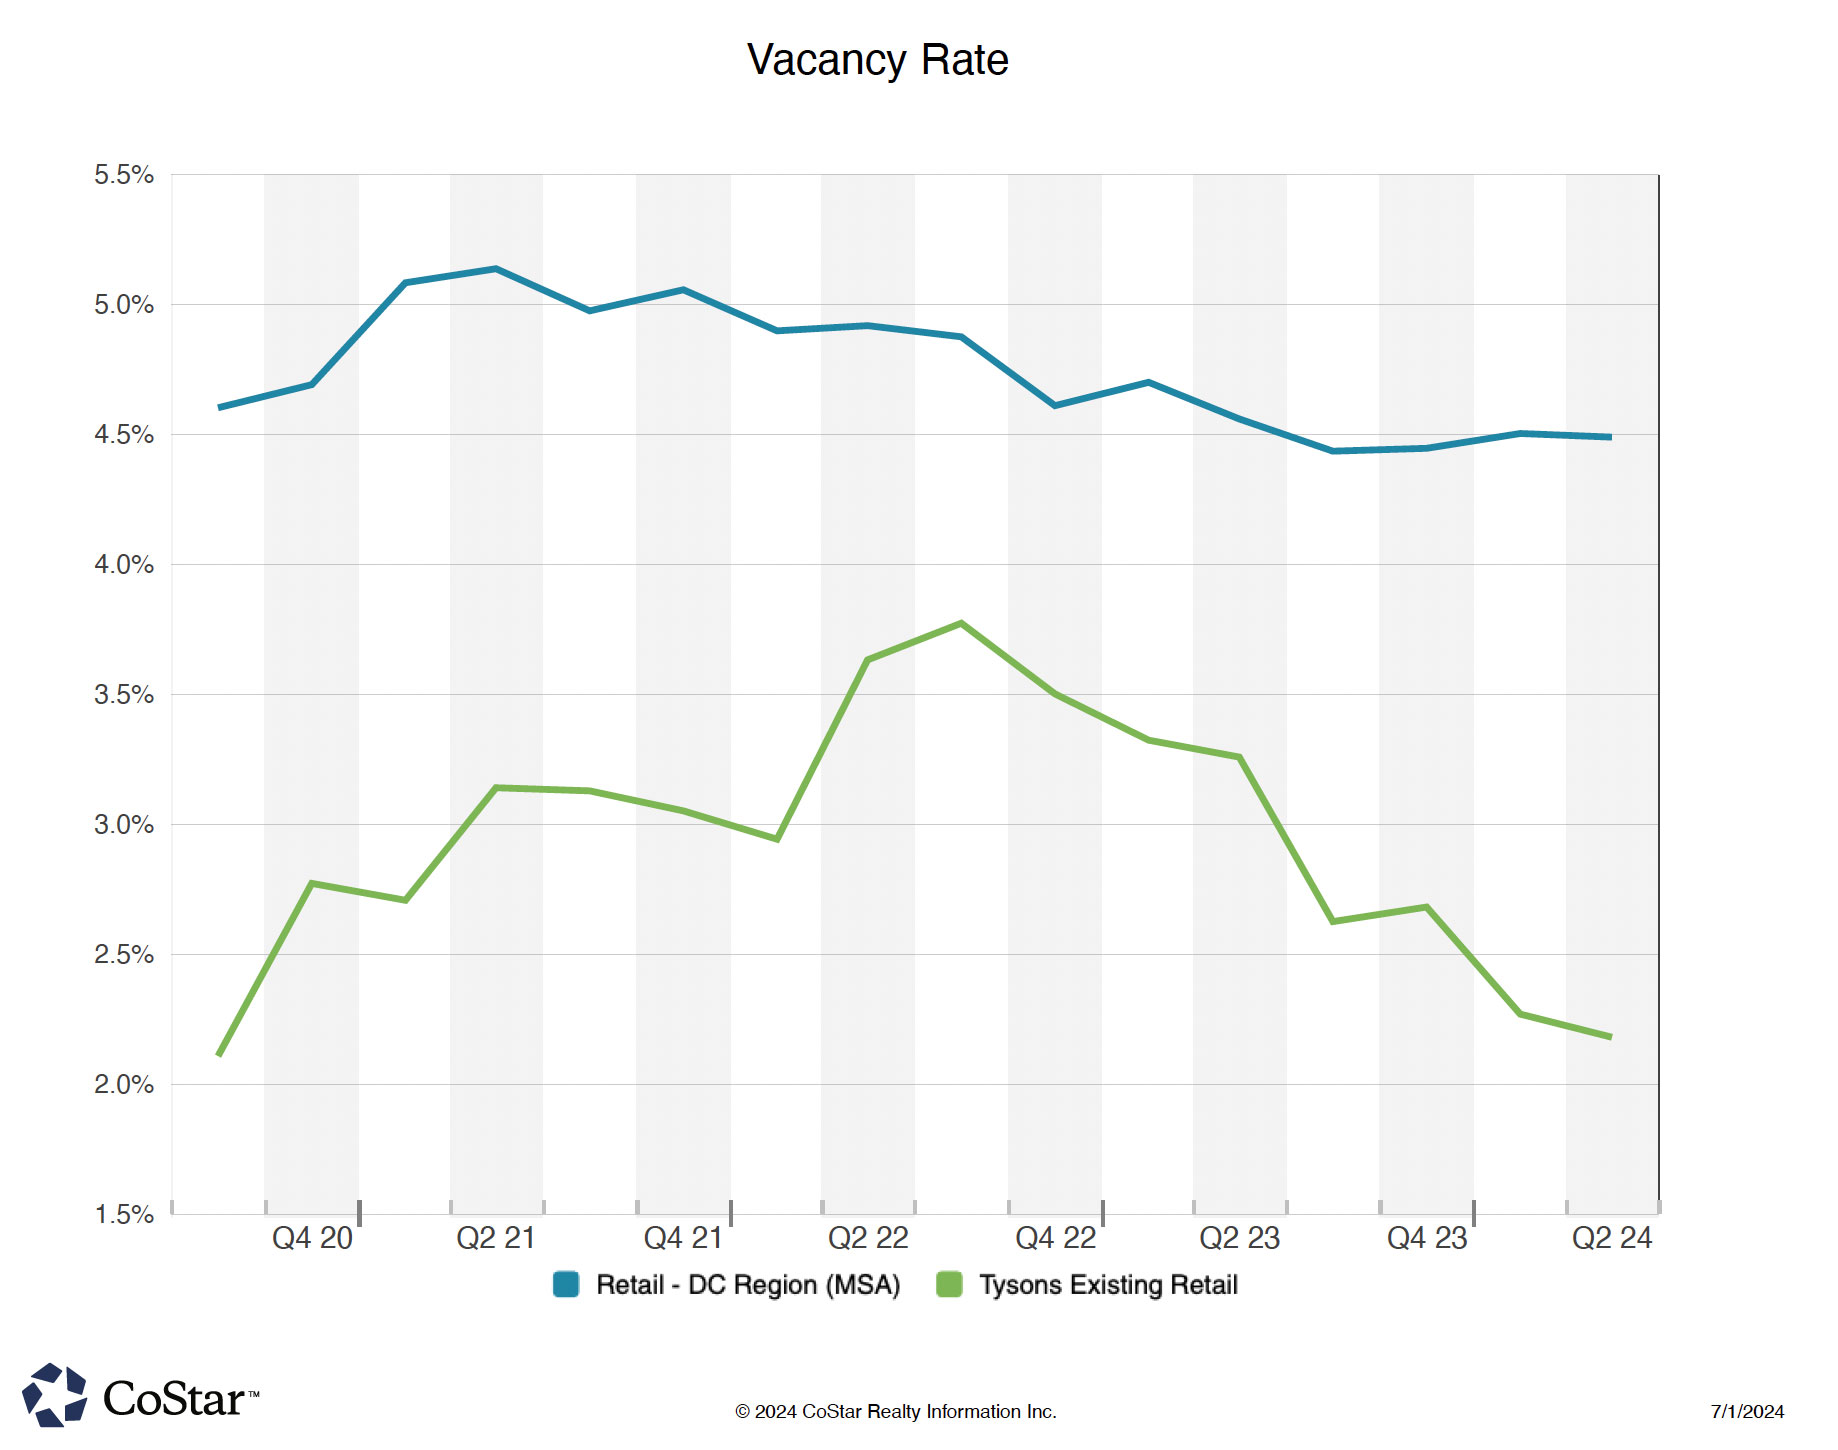
Retail
Retail Vacancy
2%
Q2 2024 CoStar
Retail
Annual Visitation
Q2 2024 Placer.ai
Retail
Monthly Visits (Previous 12 Months)
Q2 2024 Placer.ai
Retail
Origin of Retail Spending
65%
of the $2.4B spent in Tysons emanates from visitors.
2023 Market Study
Retail
Share of Fairfax County's Total Sales Tax Revenue
10%
2023 Market Study

Retail
Total Retail Stores
345
2023 Market Study
Retail
Total Restaurants & Bars
101
2023 Market Study
Retail
Total Entertainment Venues
42
2023 Market Study
Retail
Total Grocery Stores
7
2023 Market Study
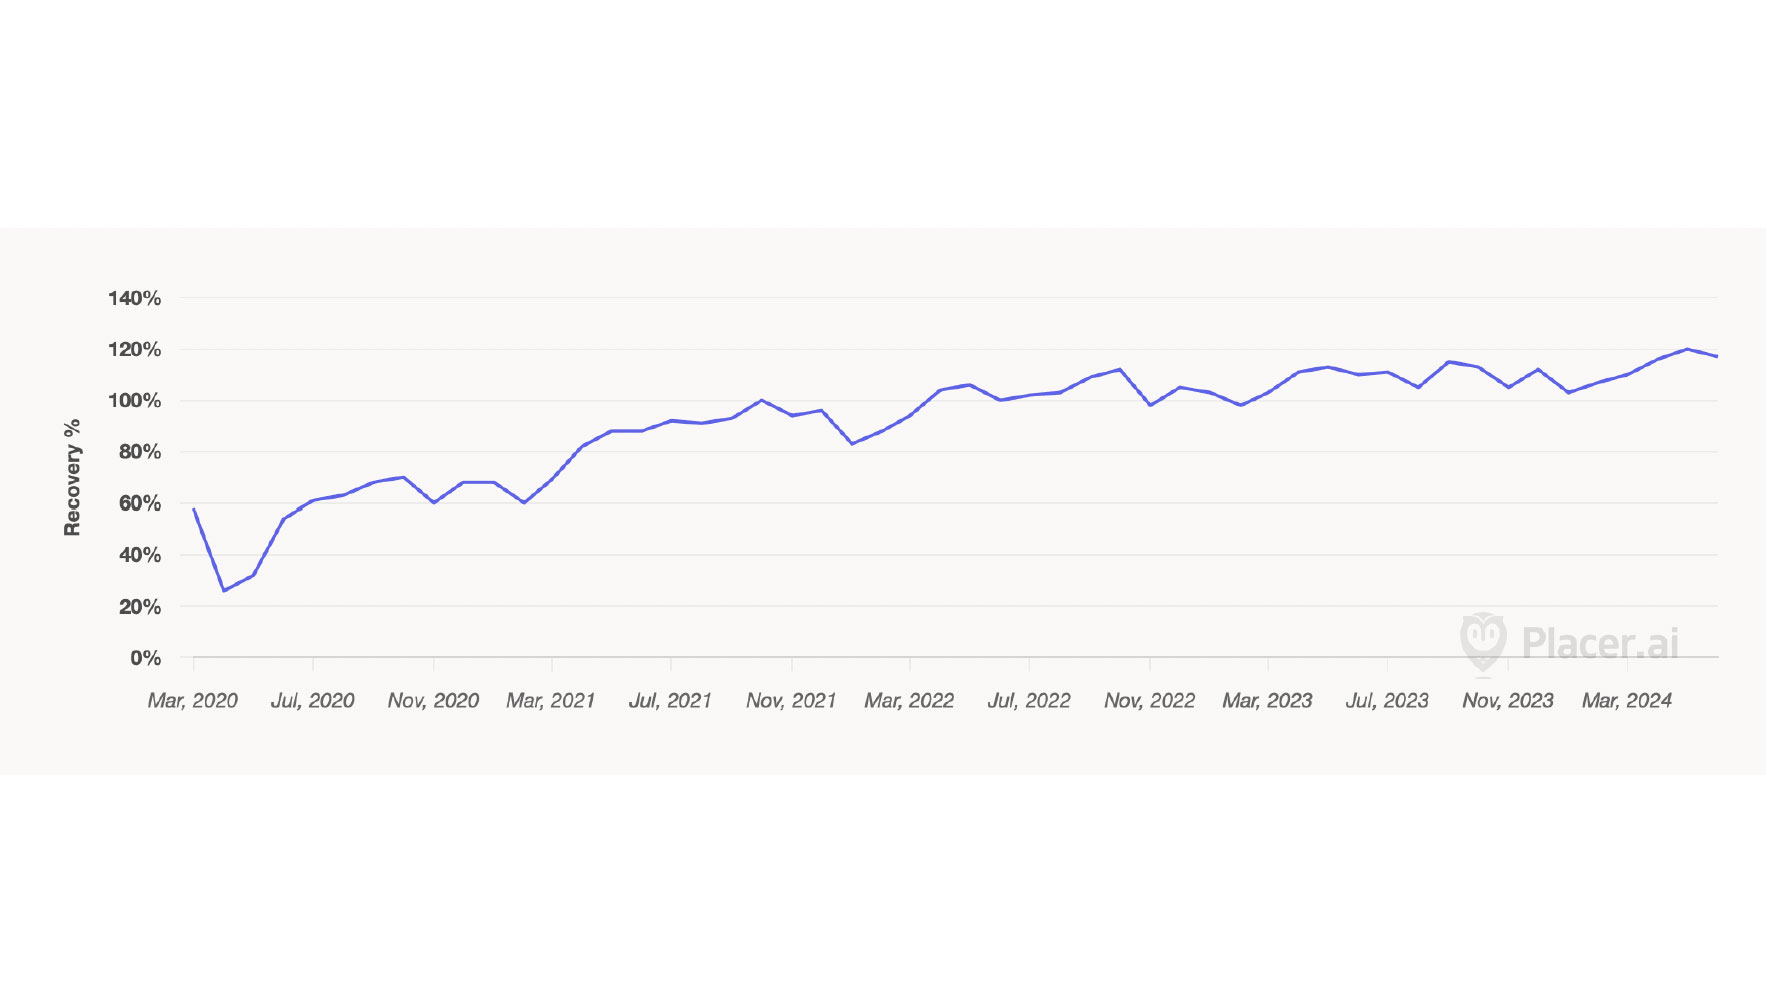
Retail
Retail Recovery Index
118%
Q2 2024 Placer.ai
Hospitality
Hotel
Hotel Inventory
14
2023 Market Study
Hotel
Number of Hotel keys/rooms
3.2K
2023 Market Study
Hotel
Existing Meeting Space
94K
Square Feet
2023 Market Study
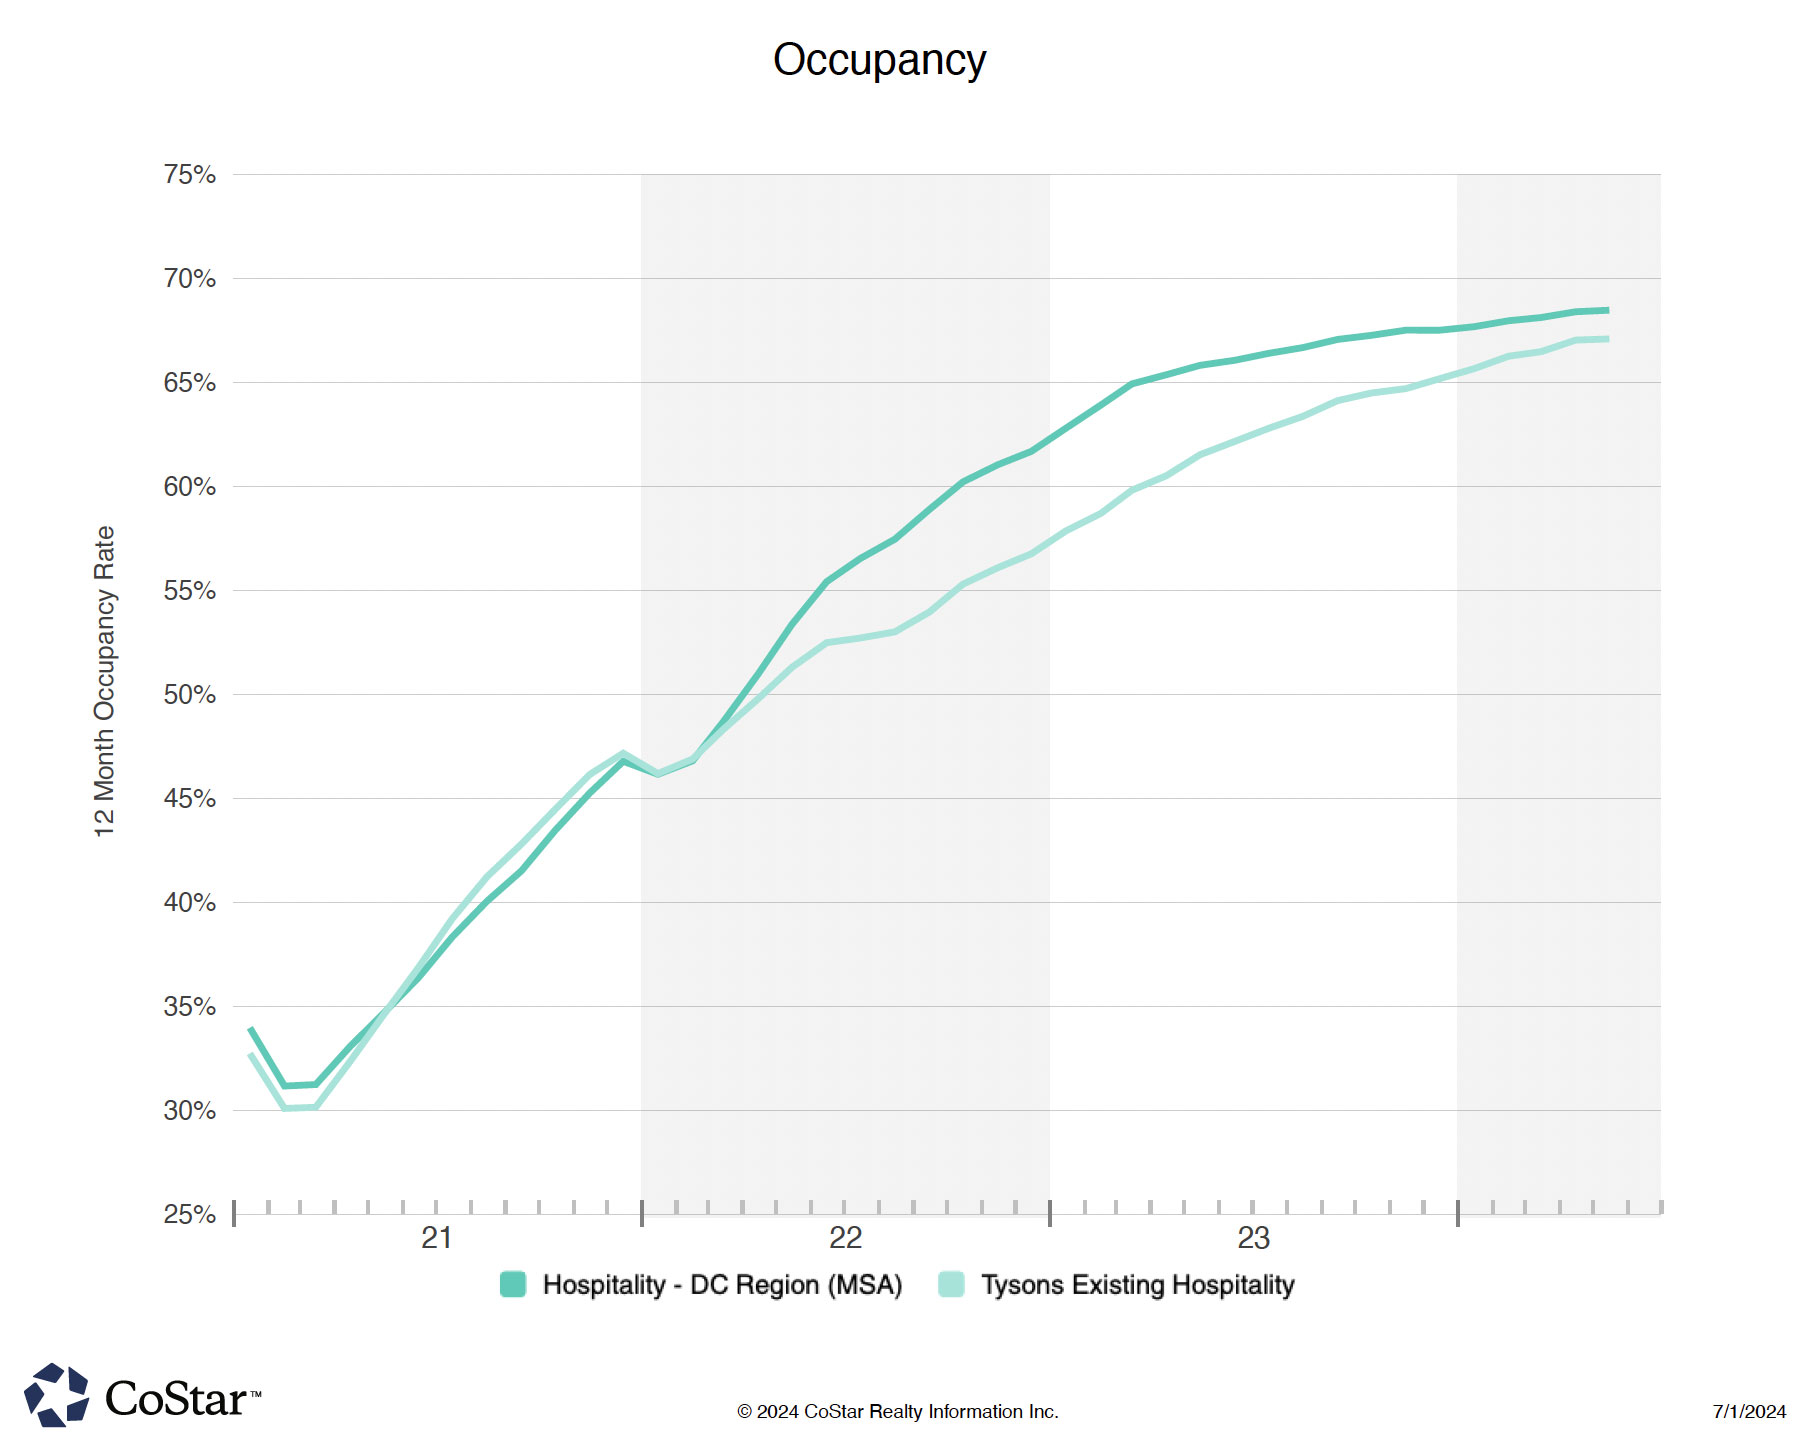
Hotel
Average Occupancy
67%
Q2 2024 CoStar
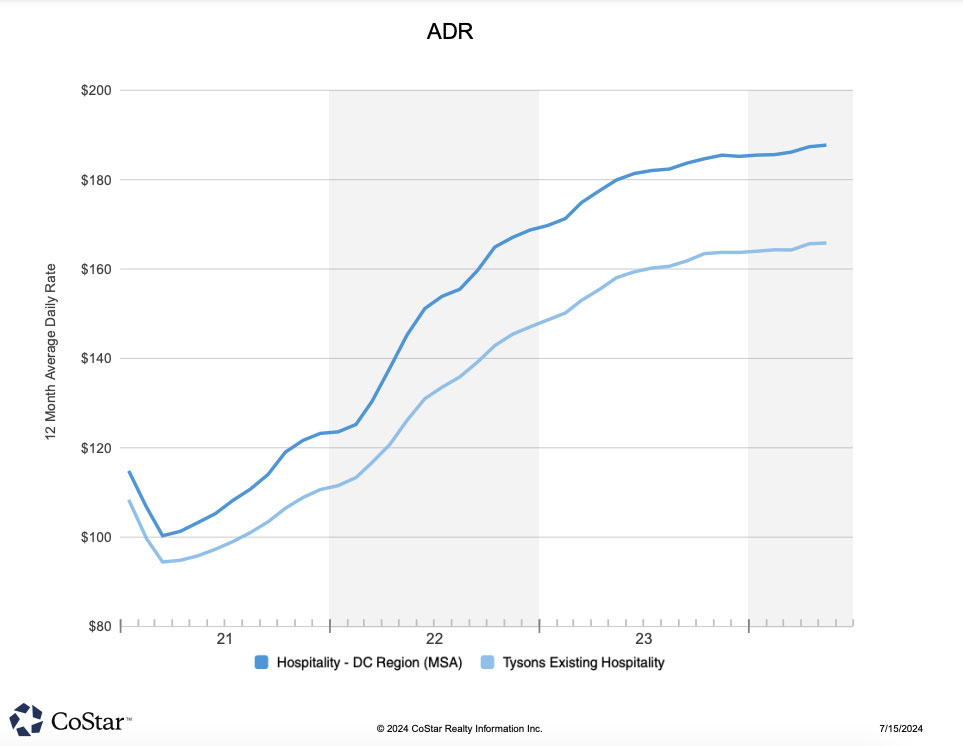
Hotel
Average ADR per night
$165
Q2 2024 CoStar
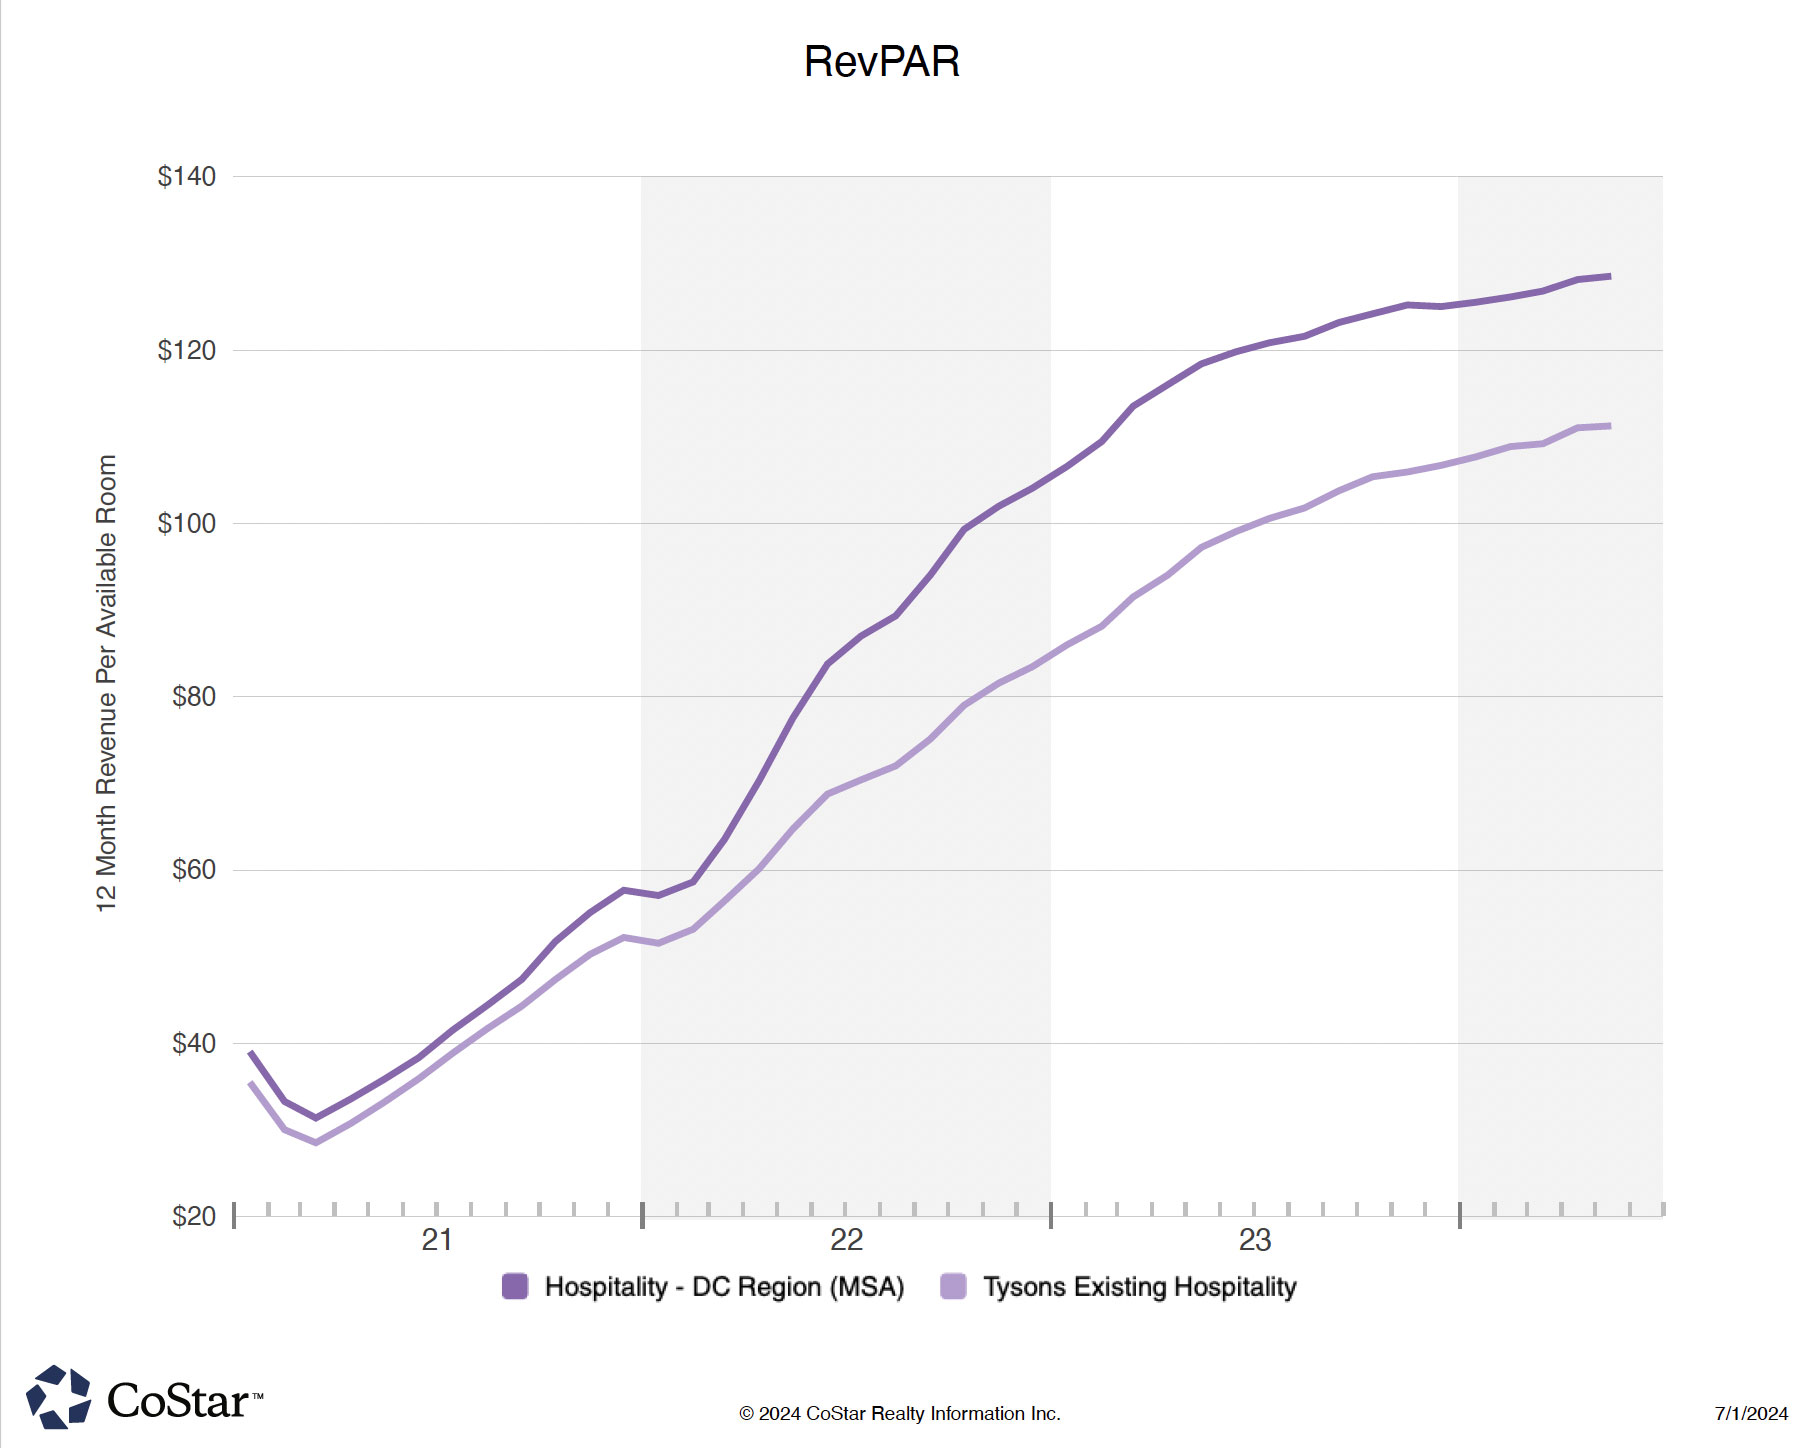
Hotel
Average RevPAR
$111
Q2 2024 CoStar

Hotel
Revenues by Type
2023 Market Study
Hotel
Over-Night Visitors per Year
510k
2023 Placer.ai
Hotel
Over-Night Visitors YoY growth
+17.2%
2023 Placer.ai
Hotel
Covid-19 Hotel Recovery
+27%
Since 2021
2023 Costar