Tysons DataHub
Learn more about the size of Tysons’ geography, workforce, community composition, and economic impact on Fairfax County
Summary
Demographic
Total Population
29K
2023 Market Study
Employment
Total Workers
116K
2023 Market Study
Market
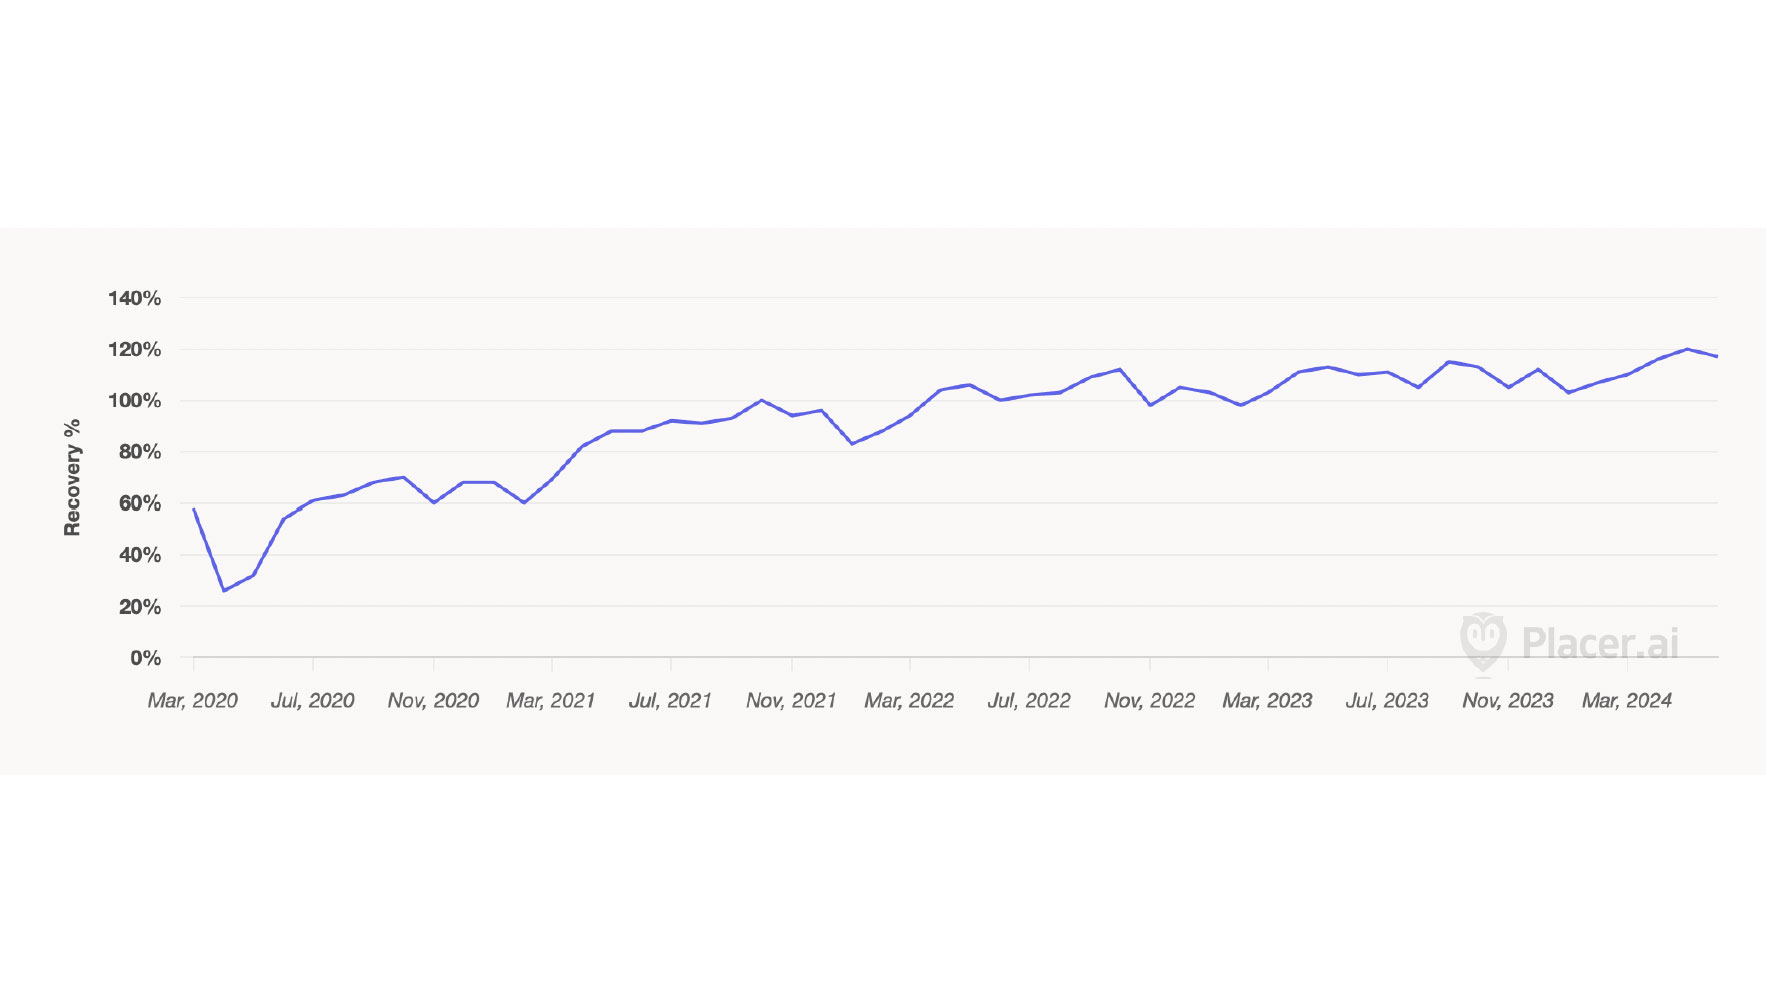
Annual Visitors
5.4M
2023 Placer.ai
Market
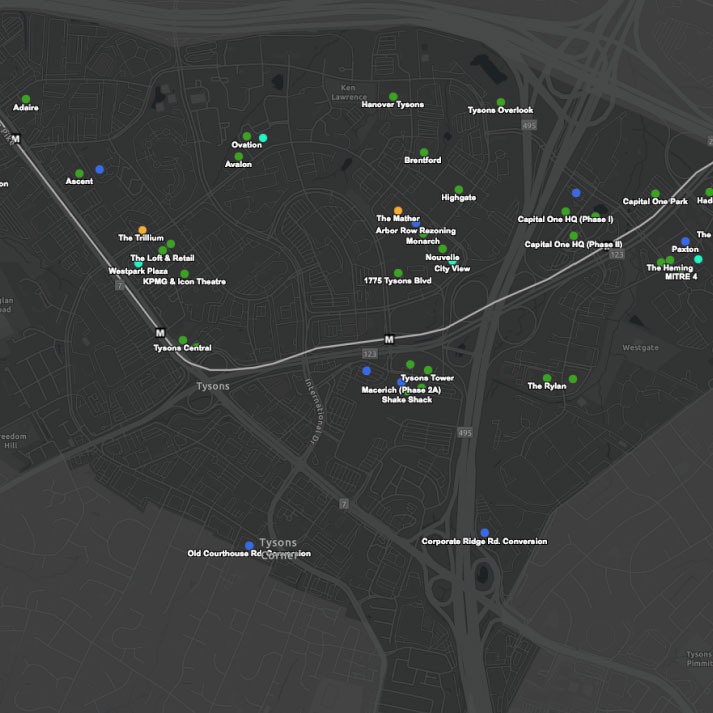
Total Development GFA
60M+
2023 Tysons Tracker
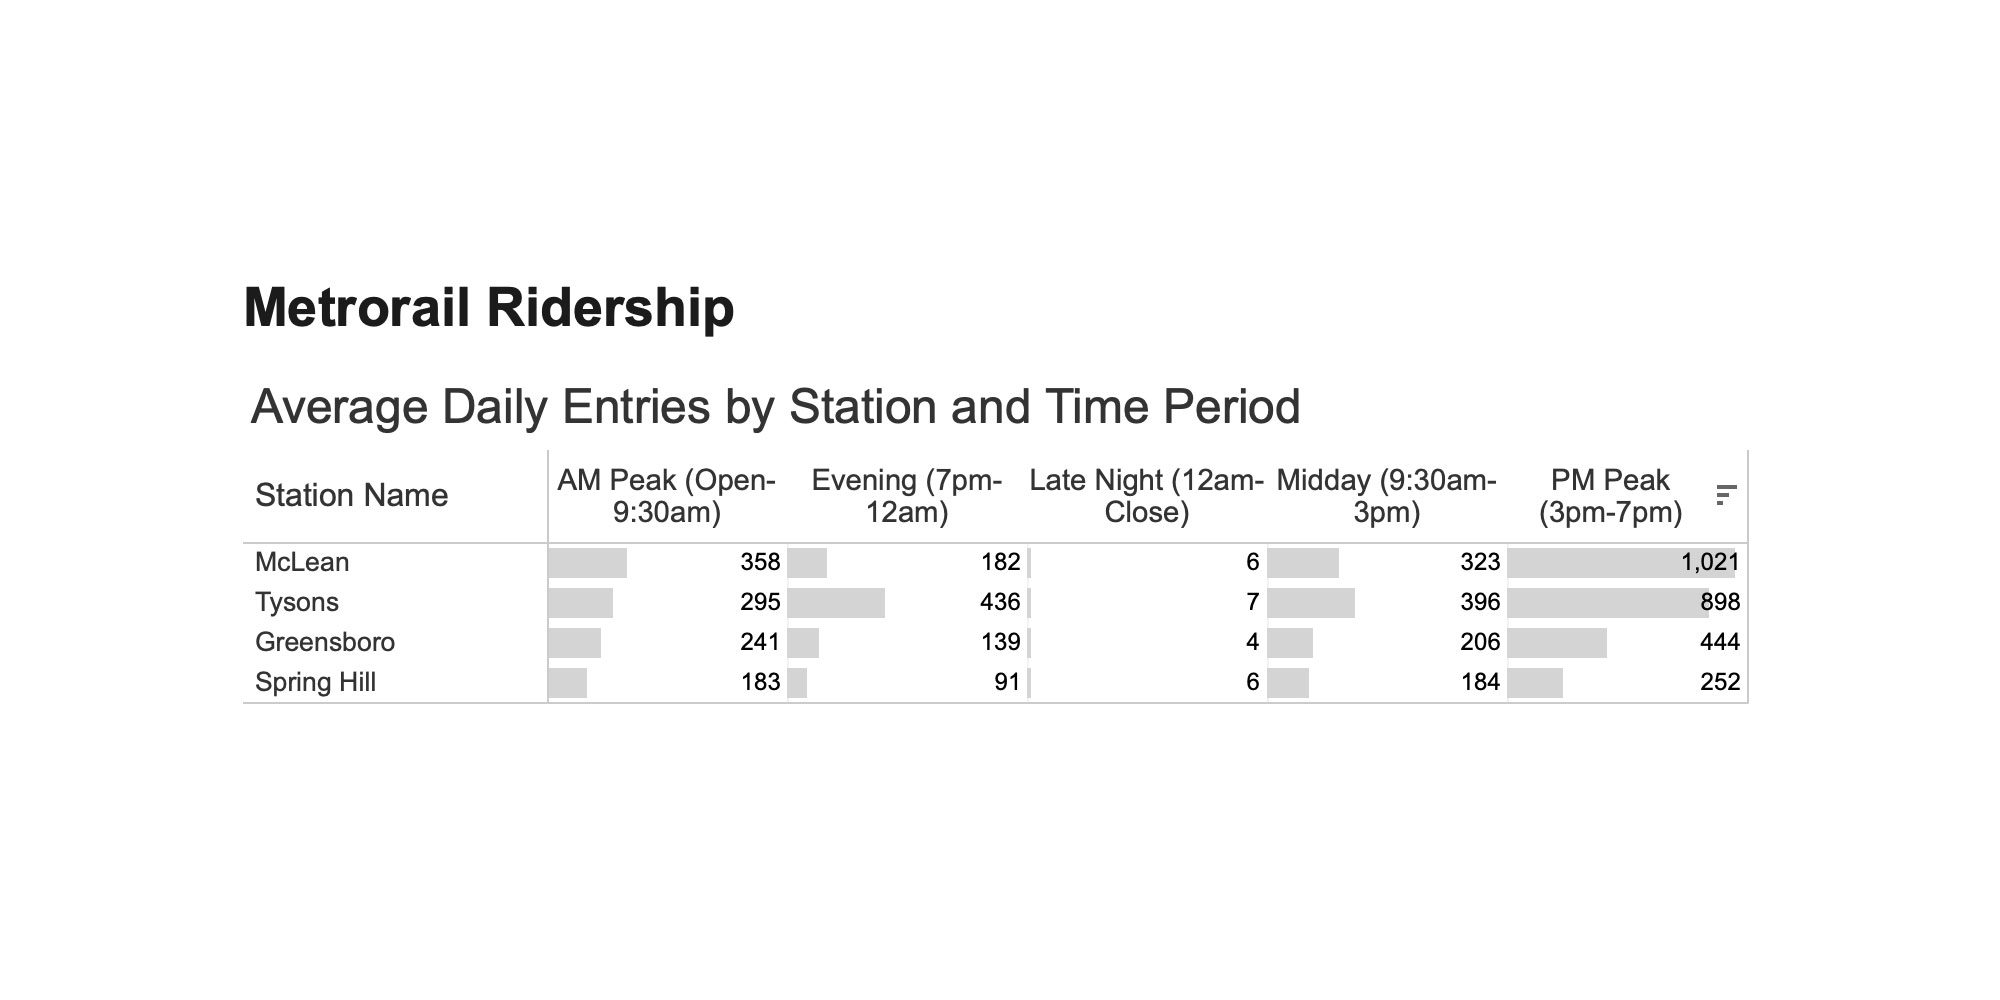
Transit
Metro Ridership
Q2 2024 WMATA
Market
Tysons Visitation
Q2 2024 Placer.ai


Economy
Economy
Fiscal Impact
Assessed Value:
$268M
2023 Market Study
Economy
Share of Fairfax County's Total Tax Revenue
8%
2023 Market Study
Economy
Share of Fairfax County's Total Assessed Value
5%
2023 Market Study
Economy
Percent of Fairfax County's total Landmass
1%
2023 Market Study
Economy
Share of Fairfax County's Total Sales Tax Revenue
10%
2023 Market Study
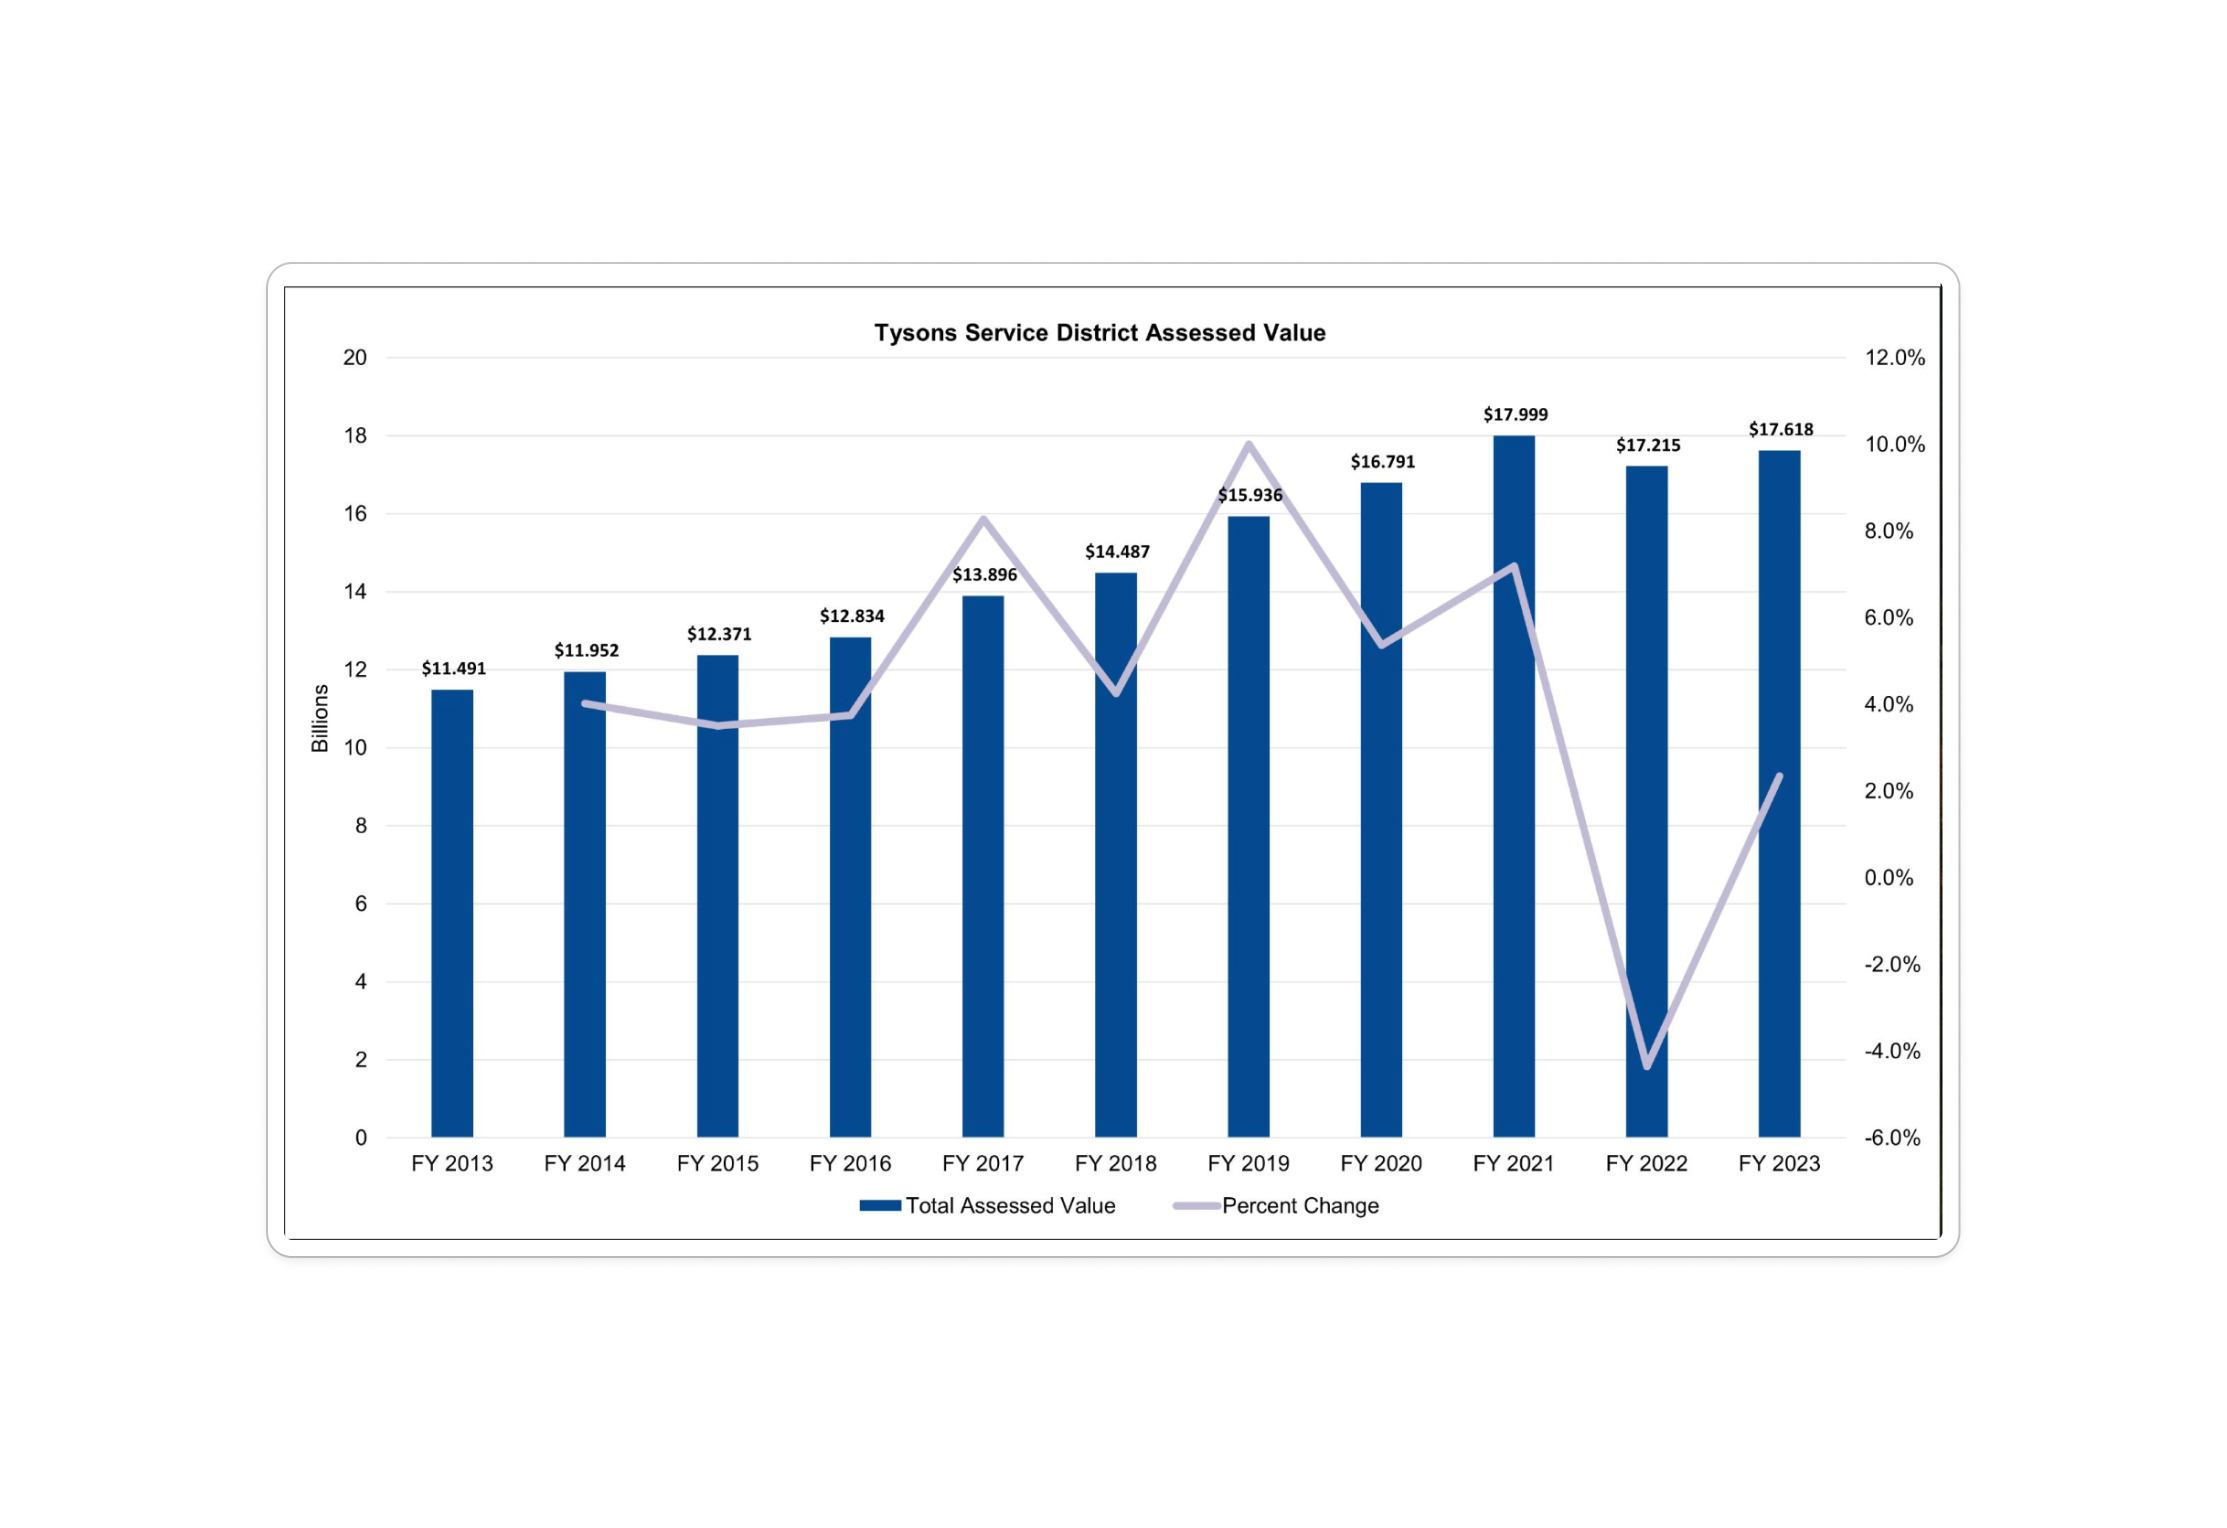
Economy
Annual Assessed Tax Value (Billions)
2023 Fairfax County
Workforce
Fortune 500 HQs
5
2023 EDA
Workforce
Total Businesses
3,891
2023 NAICS
Demographics
Demographic
Total Population
29K
2023 Market Study
Demographic
5-Yr Annual Avg. Pop. Growth
3.8%
2022 Census (5-yr ACS)
Demographic
Projected Avg. Annual Pop. Growth 2023-30
4.6%
2023 Market Study

Demographic
Total Households
13K
2022 Census (5-yr ACS)
Demographic
Avg. Annual Household Growth
5.3%
2022 Census (5-yr ACS)
Demographic
Average Persons per Household
2.05
2022 Census (5-yr ACS)
Demographic
Median Income
$129K
2022 Census (5-yr ACS)
Demographic
Racial Distribution
2022 Census (5-yr ACS)
Demographic
Age Distribution
2022 Census (5-yr ACS)
Demographic
Income Distribution
2022 Census (5-yr ACS)
Workforce
Employment
Workers by Industry
2023 Market Study
Employment
Total Workers
116K
2023 Market Study
Employment
Employment Growth 2020-2023
2.8%
2023 Market Study
Employment
2nd
Largest Employment Center in the DC Region
Employment
Share of Fairfax County Total Employment
15%
2023 Market Study
Employment
Monthly Employee Visits (Previous 12 Months)
Q2 2024 Placer.ai
Employment
Annual Employee Visits
Q2 2024 Placer.ai